
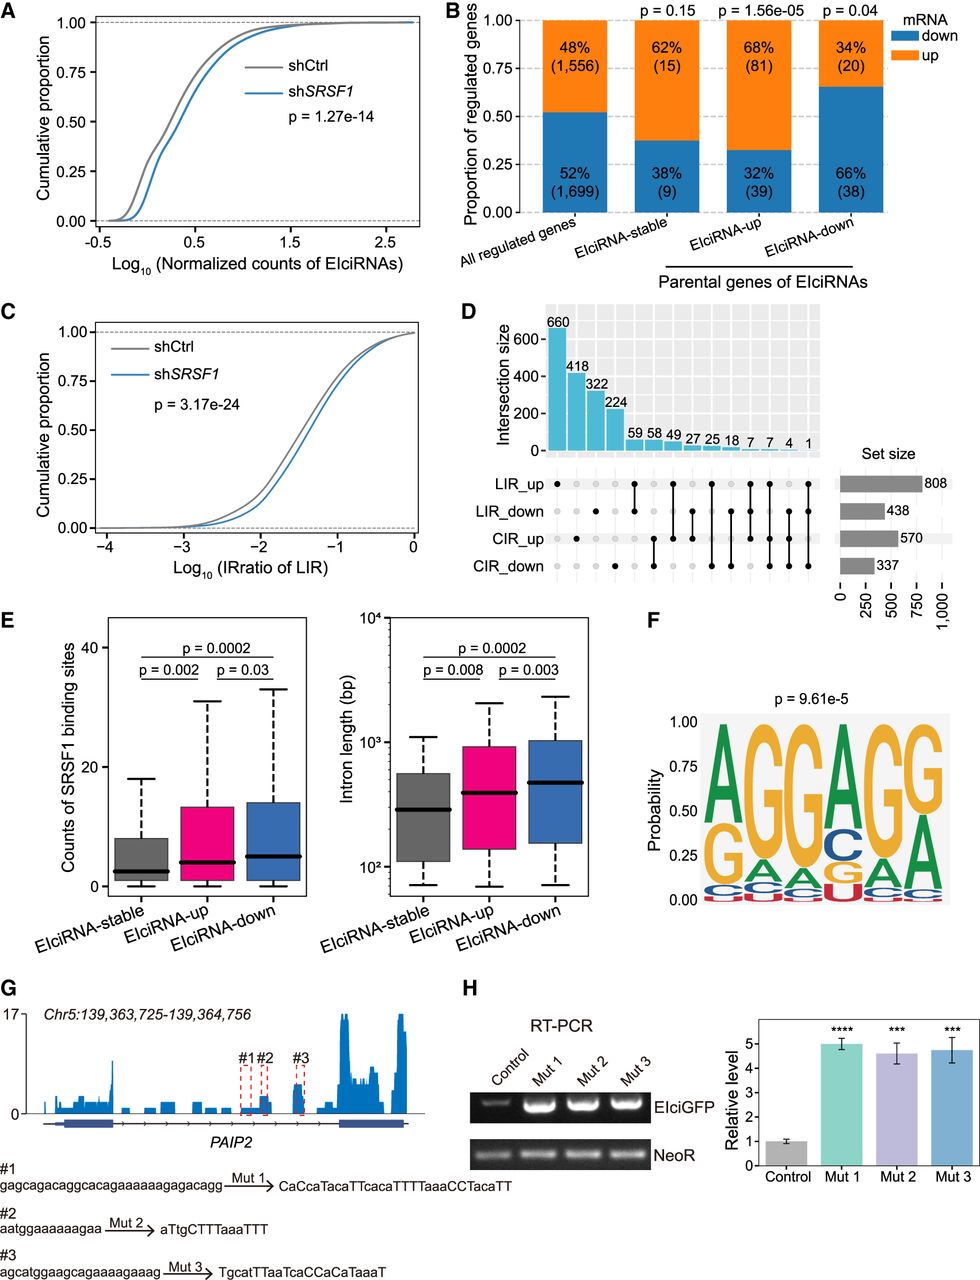
SRSF1 binds to CIR to inhibit EIciRNA biogenesis. (A) Cumulative distribution of normalized EIciRNA expressions in HEK293 cells treated with shRNA targeting SRSF1. (shCtrl) shRNA with scrambled sequences, (shSRSF1) shRNA against SRSF1. (B) Changes of EIciRNA parental genes upon SRSF1 knockdown. (EIciRNA-up) Up-regulated EIciRNAs upon SRSF1 knockdown, (EIciRNA-down) down-regulated EIciRNAs upon SRSF1 knockdown, and (EIciRNA-stable) unaltered EIciRNAs upon SRSF1 knockdown. (C) Cumulative distribution of the IRratio of LIR in HEK293 cells treated with shRNA targeting scramble sequence or SRSF1. (D) UpSet plot showing the overlap of genes harboring LIR or CIR regulated by SRSF1. (E) Boxplots displaying the counts of SRSF1 binding sites in CIR and the length of CIR in the indicated groups. (F) Predicted binding motif from SRSF1 iCLIP-seq reads mapped to introns retained in up-regulated EIciRNAs upon SRSF1 knockdown. (G) Integrative Genomics Viewer (IGV) (Robinson et al. 2011) snapshot showing the SRSF1 iCLIP-seq signals in the EIciPAIP2 locus. Three SRSF1 binding GA-rich regions in the retained intron of EIciPAIP2 are framed as red dotted lines and labeled as #1, #2, and #3, respectively. (H) Semiquantitative RT-PCR gels and the quantification of EIciGFP levels in HEK293 cells after transfection of indicated mutation plasmids. The eukaryotic resistance gene (NeoR) of the plasmids was used as the loading control. In A and C, P-values were calculated with the Wilcoxon rank-sum test. In B, P-values calculated with the chi-squared test were shown for the comparison of proportion between the indicated group of genes against all regulated genes by SRSF1 knockdown. In E, P-values were calculated with the two-tailed Student's t-test. In H, error bars represent SD in triplicate experiments, and P-values were calculated with the two-tailed Student's t-test. (***) P < 0.001, (****) P < 0.0001.


