
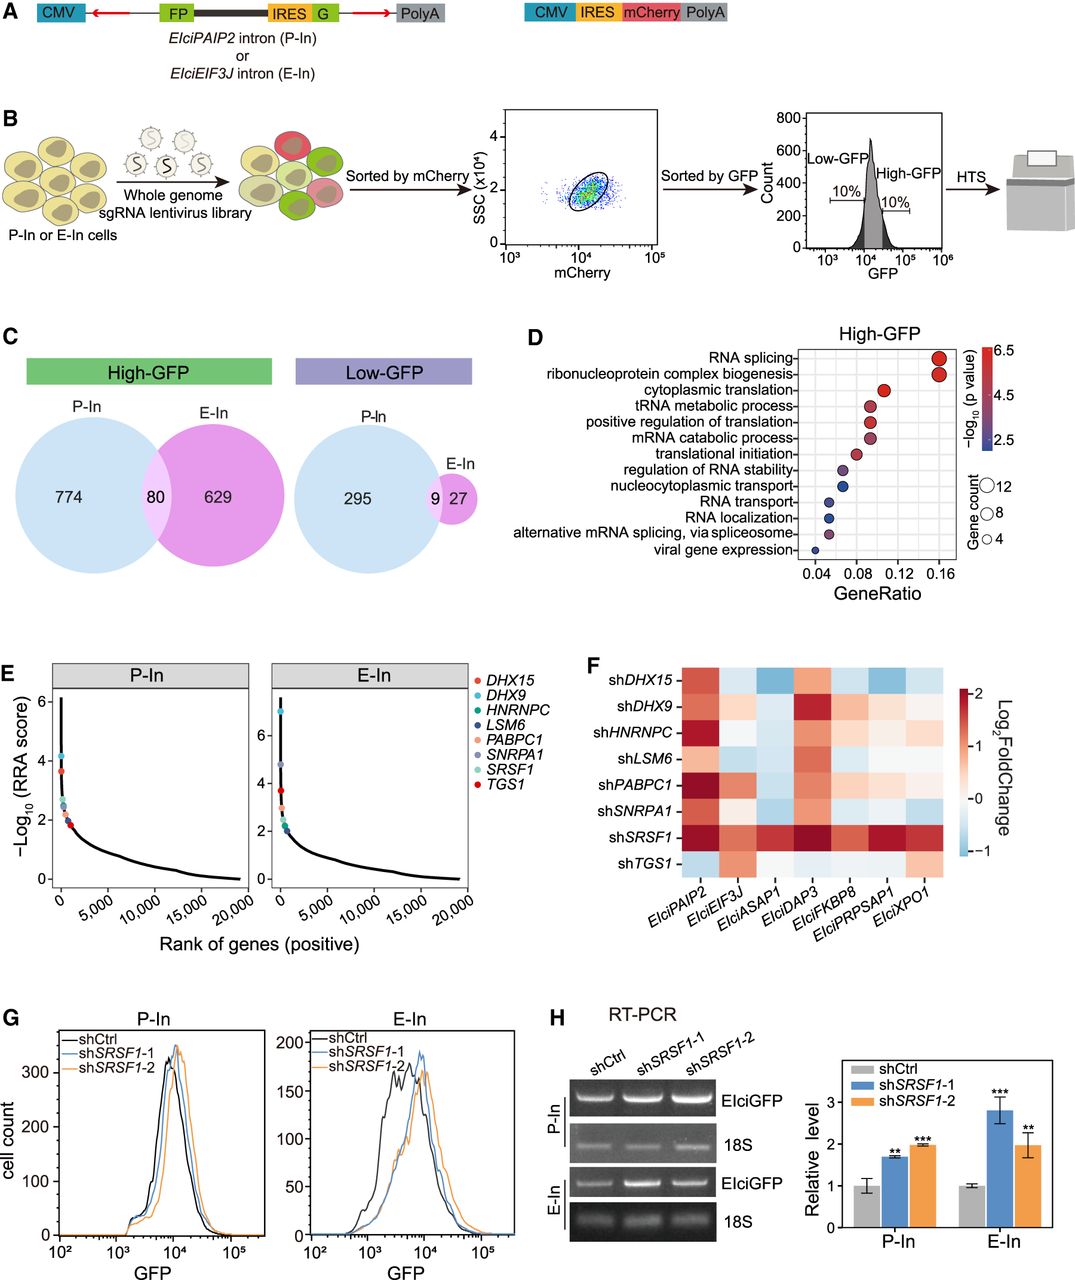
Genome-wide CRISPR screen identifies regulators of EIciRNA biogenesis. (A) Constructs for expressing GFP and mCherry protein reporters. The reverse complementary sequence (red arrows) in the flanking introns was used for the circularization of split GFP. The retained introns of two reported EIciRNAs (EIciPAIP2 and EIciEIF3J) were inserted between the split GFP (FP) and IRES sequences. Two GFP reporters (P-In for EIciPAIP2 and E-In for EIciEIF3J) were stably integrated into the genome of HEK293 cells along with the mCherry construct (Supplemental Methods). (B) Procedure of genome-wide CRISPR screen. Two reporter cells (P-In or E-In) were infected with the lentivirus sgRNA library and selected with 1 μg/mL puromycin for 7 d. The infected cells expressing mCherry proteins were gated with FACS, and 10% cell populations of high-GFP and low-GFP were used for genomic extraction, PCR amplification, and HTS. (C) Venn diagram showing the overlapped genes with significantly enriched sgRNAs in the screens of P-In or E-In reporters. (D) GO analysis of 80 genes overlapped in high-GFP of both P-In and E-In groups. (E) Ranks of eight RBPs enriched in the biological process of RNA splicing. Ranks were calculated using MAGeCK (Li et al. 2014). (F) Heatmap showing the relative fold change of seven EIciRNAs examined by RT-qPCR when eight RBPs were individually knocked down by shRNA. (G) Flow cytometric analysis showing the GFP expression in P-In (left) and E-In (right) cells upon SRSF1 knockdown. (shCtrl) shRNA with scrambled sequences, (shSRSF1-1, shSRSF1-2) two independent shRNAs against SRSF1. (H) Semiquantitative RT-PCR gels and quantification of the EIciGFP levels in P-In and E-In cells after SRSF1 knockdown. 18S rRNA was used as the loading control. Error bars represent standard deviation (SD) in triplicate experiments. P-values from two-tailed Student's t-test. (**) P < 0.01, (***) P < 0.001.


