
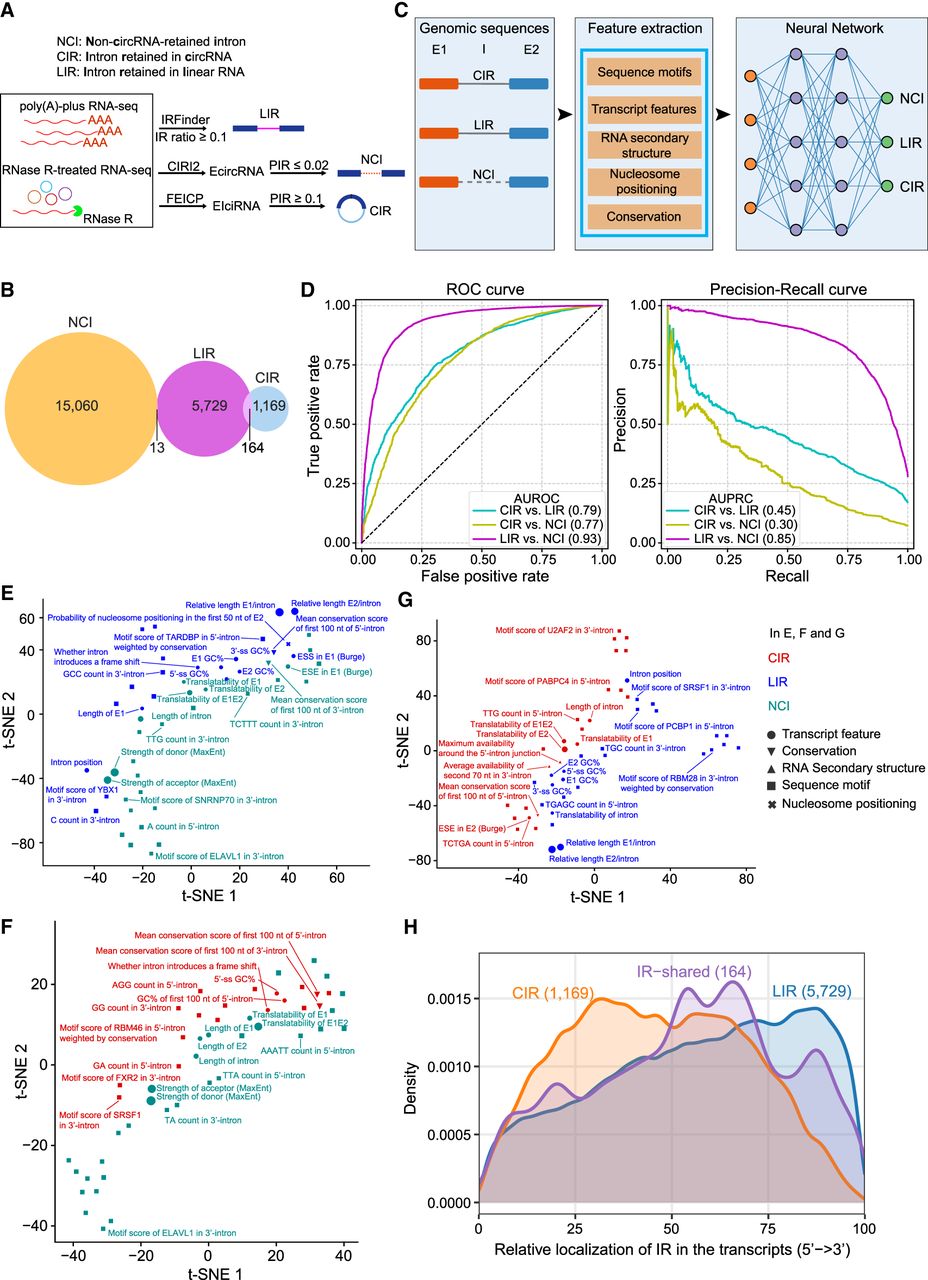
Features of CIR compared with LIR and the other introns. (A) A schematic demonstration of the identification of LIR, NCI, and CIR. LIR was detected from poly(A)-plus RNA-seq data through IRFinder with the cutoff (IRratio ≥ 0.1). CIR was detected from RNase R–treated RNA-seq data using FEICP with the cutoff (percent intron retention [PIR] ≥ 0.1). NCI represents spliced introns of EcircRNAs with the cutoff (PIR ≤ 0.02). (B) Venn diagram showing the overlap of LIR, NCI, and CIR in HEK293 cells. (C) Illustrative diagram for training the neural network (NNetwork) to distinguish LIR, NCI, and CIR. (D) Performance of the NNetwork in distinguishing three groups of introns from each other. ROC curves and precision-recall curves were plotted for pairwise comparisons, with the corresponding area under the ROC curve (AUROC) and area under the precision-recall curve (AUPRC) values shown in parentheses. (E–G) Scatter plots showing the results of t-SNE analysis of the top 50 genomic features for distinguishing NCI and LIR (E), NCI and CIR (F), and LIR and CIR (G). The colors indicate the group of introns with which a feature was positively correlated in the pairwise comparison. The point size indicates the feature importance. (H) Density curves showing the genomic distribution of LIR, CIR, and overlapped IR across their host transcripts.


