
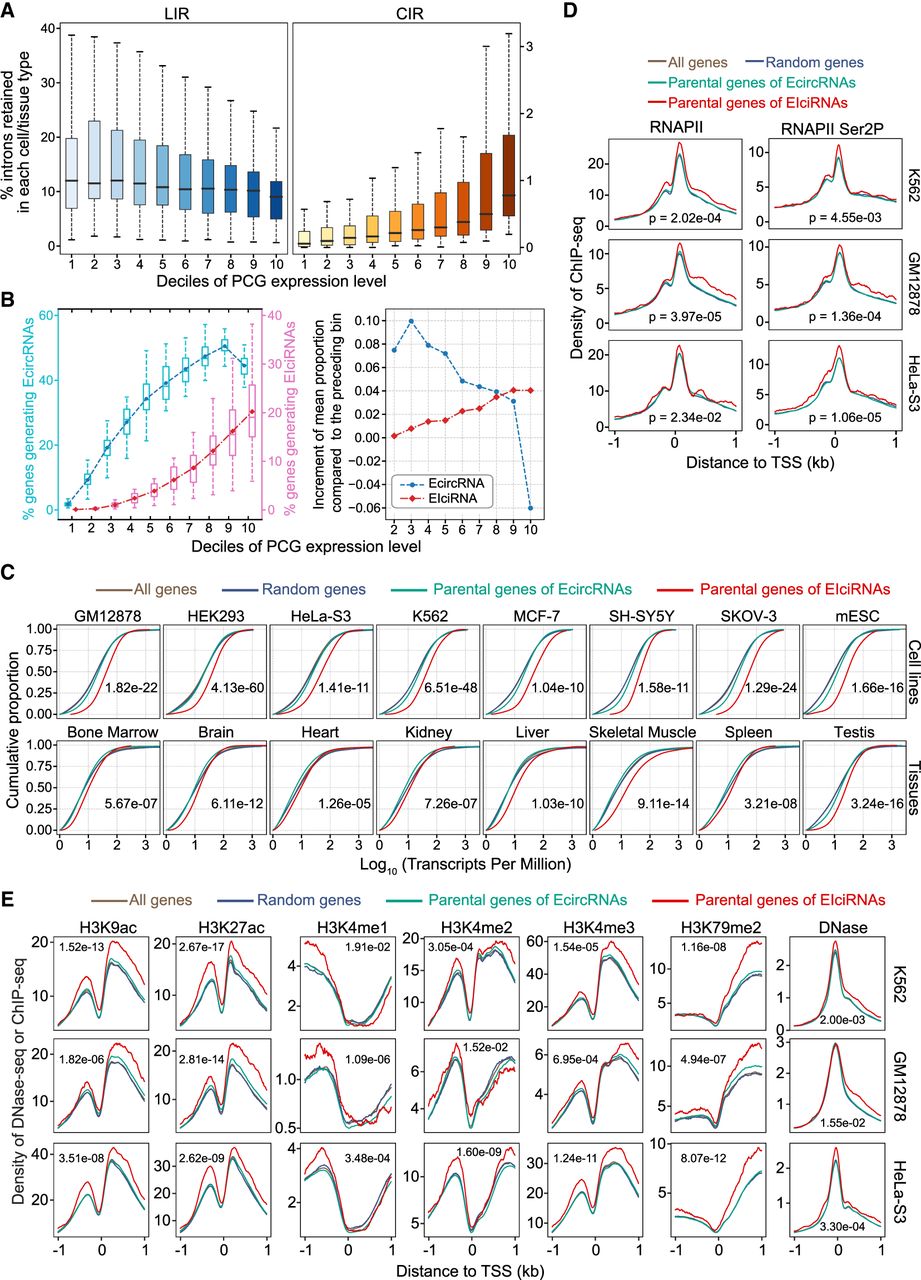
Parental genes of EIciRNAs are actively transcribed. (A) Boxplots displaying the distributions of percentages of CIRs and introns retained in linear RNA (LIRs) in 10 groups (deciles) with ranked expression levels. (B) Boxplots displaying the distributions of percentage of genes generating EcircRNAs or EIciRNAs in 10 groups (deciles) with ranked expression levels. (Left) The mean proportion in each group is indicated as a point. (Right) The increment of mean proportion of genes generating EcircRNAs or EIciRNAs compared with the preceding bin is represented as a point for each bin. (C) Cumulative distribution of expression levels (transcripts per million [TPM]) of all genes, random genes, parental genes of EcircRNAs, and EIciRNAs in eight cell lines and eight tissues. (All genes) All expressed PCGs with TPM ≥ 1, (random genes) 2000 genes randomly selected from all genes, (parental genes of EIciRNAs) PCGs generating EIciRNAs, and (parental genes of EcircRNAs) PCGs generating EcircRNAs but no EIciRNAs. (D) Distributions of RNAPII and RNAPII Ser2P ChIP-seq signals around the transcription start site (TSS) regions of the indicated groups of genes in the K562, GM12878, and HeLa-S3 cell lines. (E) DNase-seq and ChIP-seq signals of H3K9ac, H3K27ac, H3K4me1, H3K4me2, H3K4me3, and H3K79me2 around the TSS regions of the indicated group of genes in the K562, GM12878, and HeLa-S3 cell lines. In C–E, P-values were calculated with the Wilcoxon rank-sum test to compare the parental genes of EIciRNAs and parental genes of EcircRNAs.


