
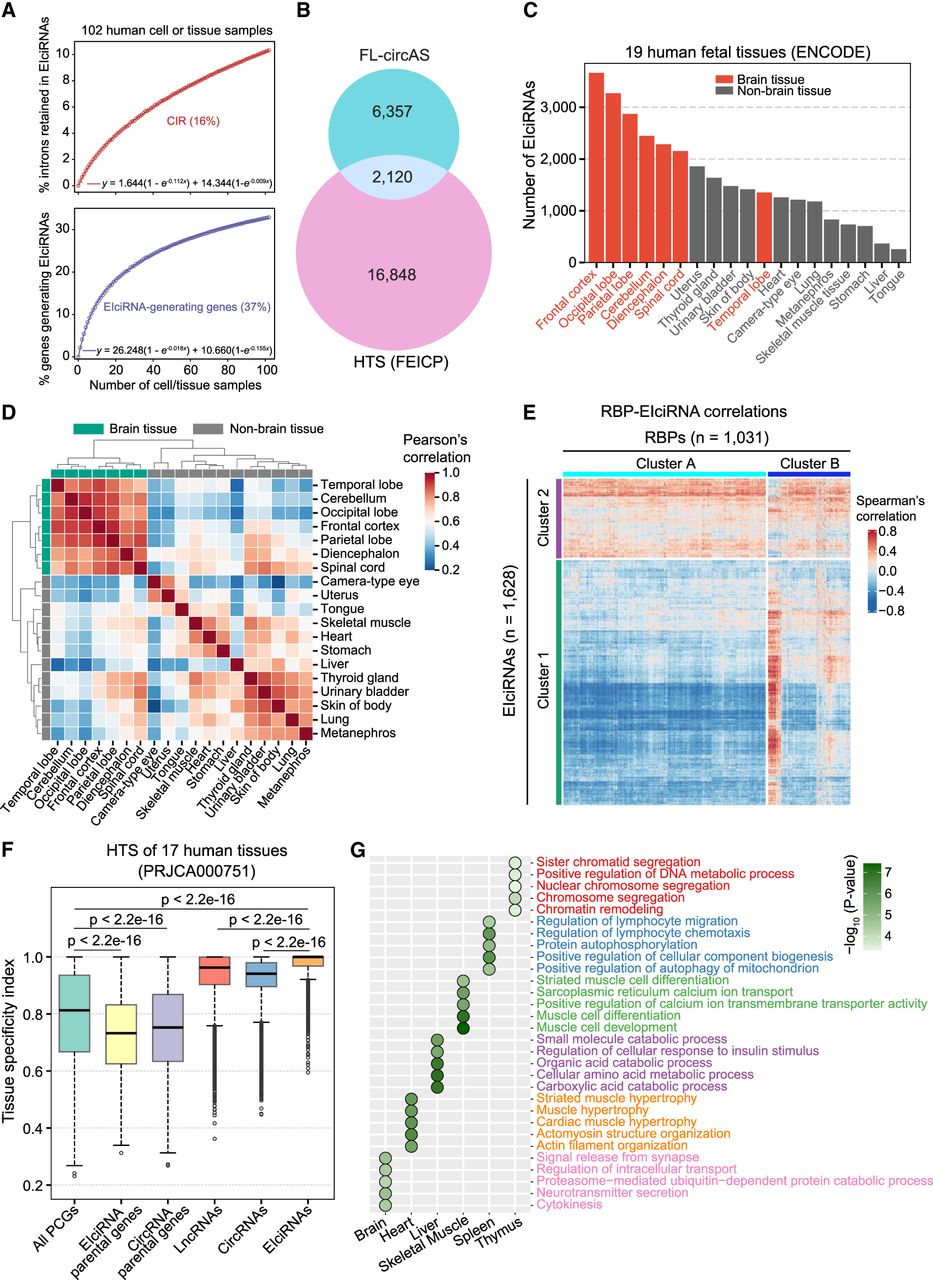
Identification and analyses of EIciRNAs in the human transcriptome. (A) The percentage of intron retained in circRNA (CIR) and genes generating EIciRNAs with the accumulating number of cell or tissue samples. The circles represent the mean values from 1000 iterations, and exponential curve fitting was applied. The corresponding equation and limit value are shown. (B) Overlap of EIciRNAs detected by FEICP and FL-circAS. (C) The number of EIciRNAs detected from ENCODE HTS data of 19 human fetal tissues. Twelve nonbrain tissues and seven brain tissues are labeled as gray and red, respectively. (D) Hierarchical clustering of EIciRNA BRPMs from 19 human fetal tissues. (E) Hierarchical clustering of Spearman's correlations of expression levels of RNA-binding proteins (RBPs) and EIciRNAs in 19 human fetal tissues. Cluster 1 and Cluster 2 are two row clusters for EIciRNAs, and Cluster A and Cluster B are two column clusters for RBPs. (F) Boxplots showing the tissue specificity index (tau) of PCGs, lncRNAs, circRNAs, and EIciRNAs, as well as parental genes of EIciRNAs and all circRNAs, from available HTS data sets (PRJCA000751) of 17 human tissues. P-values were calculated using the Wilcoxon rank-sum test. (PCGs) Protein-coding genes. (G) GO analysis of parental genes of EIciRNAs. The most significant five top GO terms are shown for six human tissues.


