
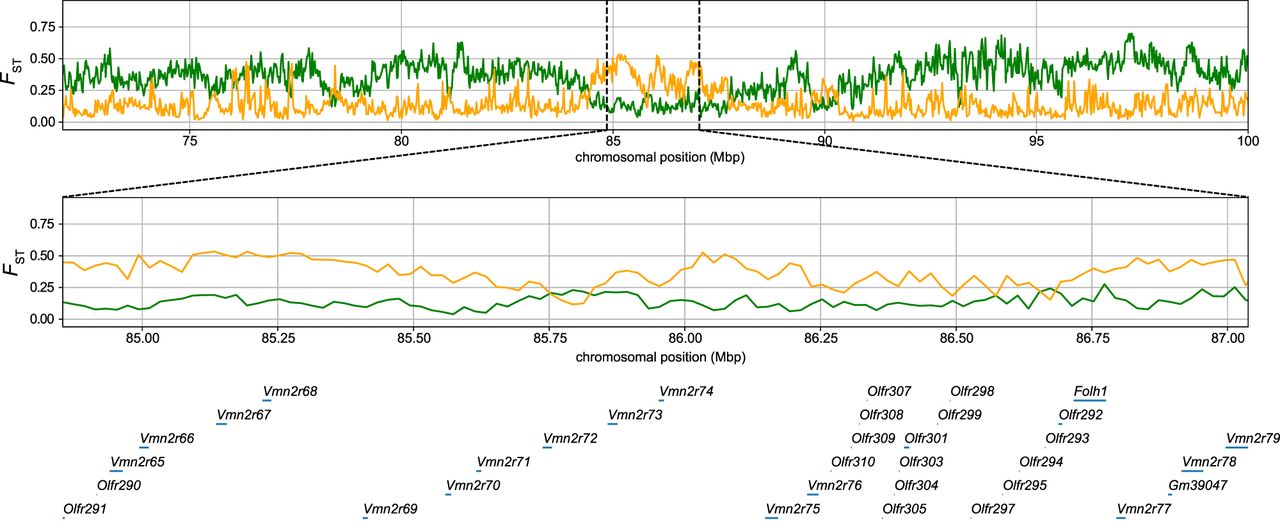
Figure 5.
Distribution of FST in 20-kb windows on Chromosome 7. The yellow and green lines indicate FST between the Japanese and subspecies musculus samples and FST between the Japanese and subspecies castaneus samples, respectively. The bottom panel shows the pattern in the olfactory/vomeronasal genes in this cluster (Chr 7: 84,853,553–87,037,968, GRCm38).


