
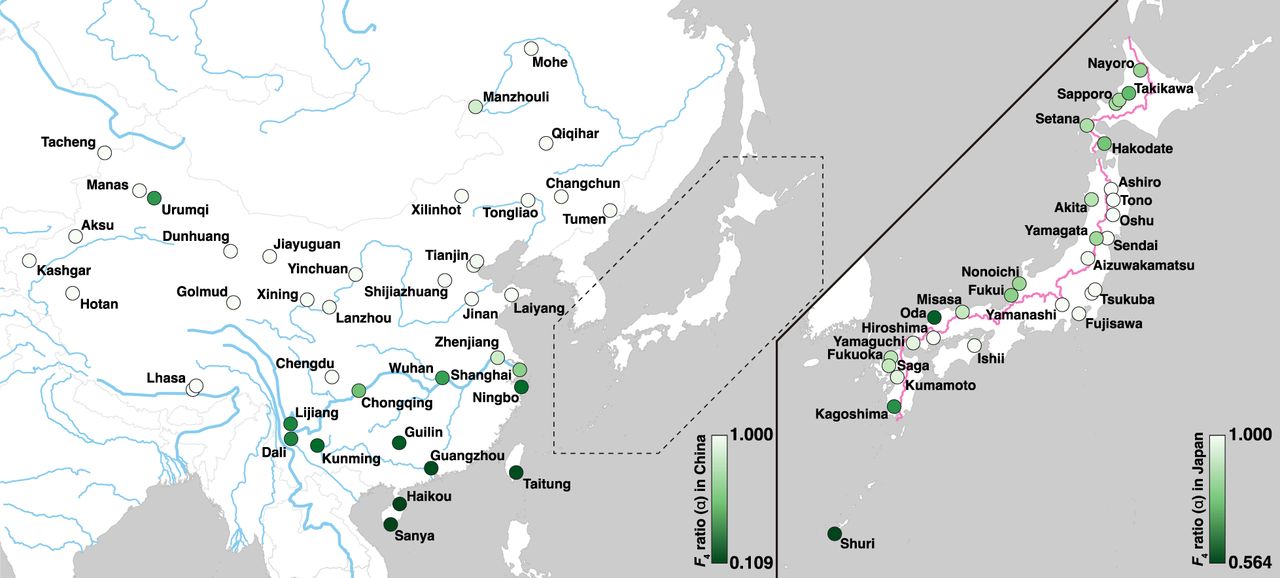
Figure 1.
Estimated ratio of musculus/castaneus ancestry in East Asia. The colors of circles indicate the musculus/castaneus ancestry of samples at each collection site: (left) East Asian samples except for the Japanese archipelago, (right) Japanese archipelago samples. The musculus ancestry and castaneus ancestry of each sample are represented by a range of colors from white to green, with the stronger green color indicating higher castaneus ancestry. The range of the ancestry ratio is indicated by the color bar in each panel. The pink line in right panel represents the central watershed in the Japanese archipelago.


