
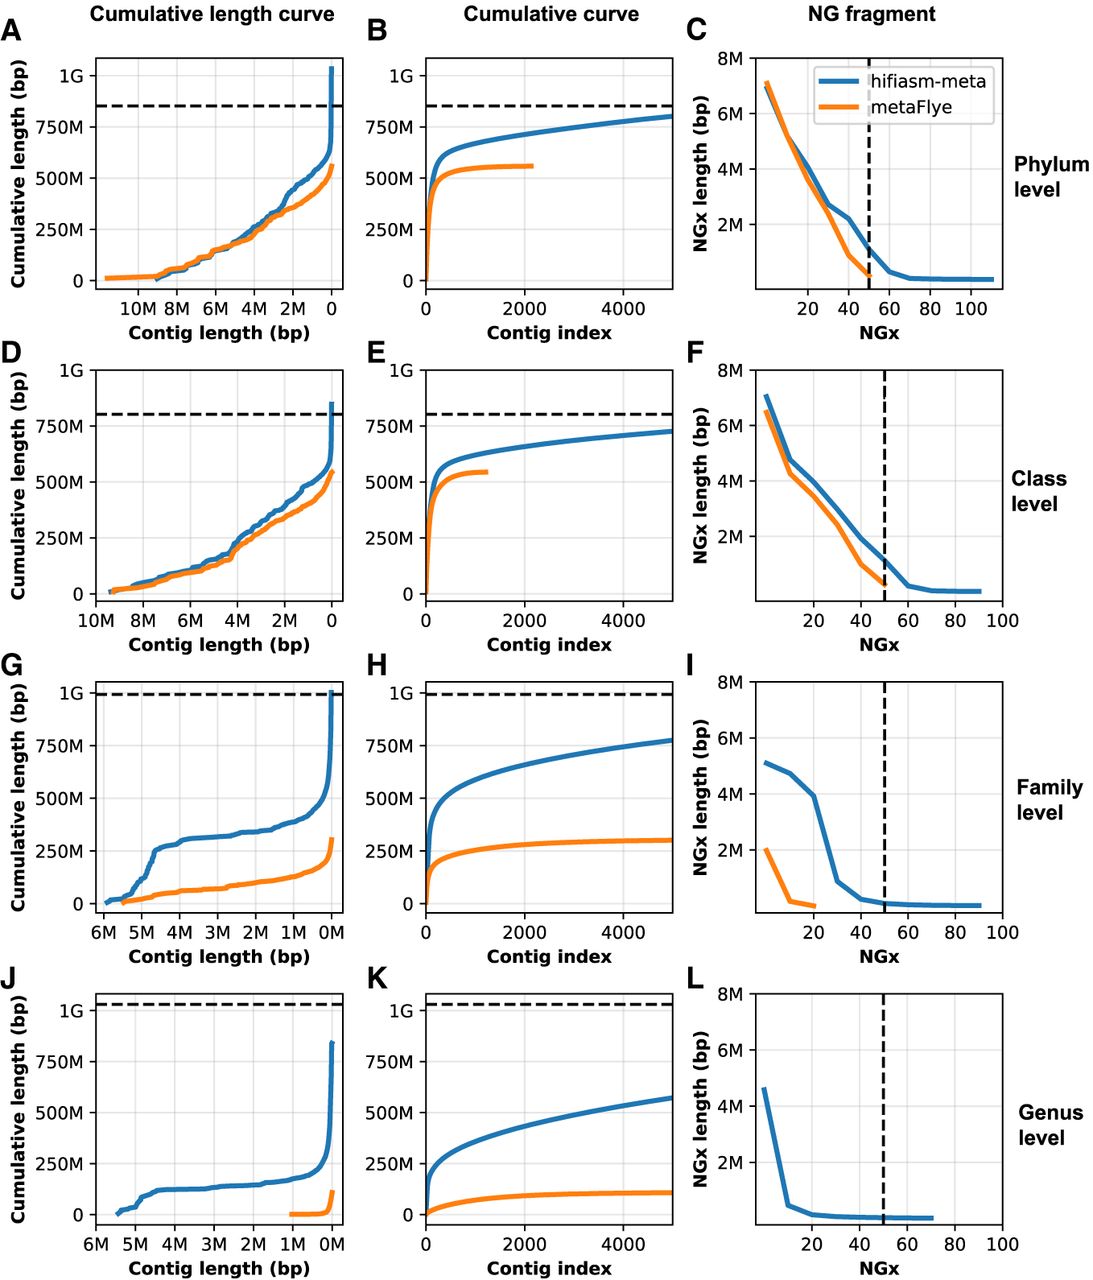
Figure 9.
Comparison of hifiasm-meta and metaFlye's contiguity at different taxonomic levels. (A–C) Phylum level, (D–F) class level, (G–I) family level, and (J–L) genus level. (A,D,G,J) The x-axis is the contig length (sorted in decreasing order), and the y-axis is the cumulative contig lengths. (B,E,H,K) The x-axis represents the contig index (sorted in decreasing order), and the y-axis is the cumulative contig length. (C,F,I,L) Values for NGx; the dashed vertical line indicates the NG50.


