
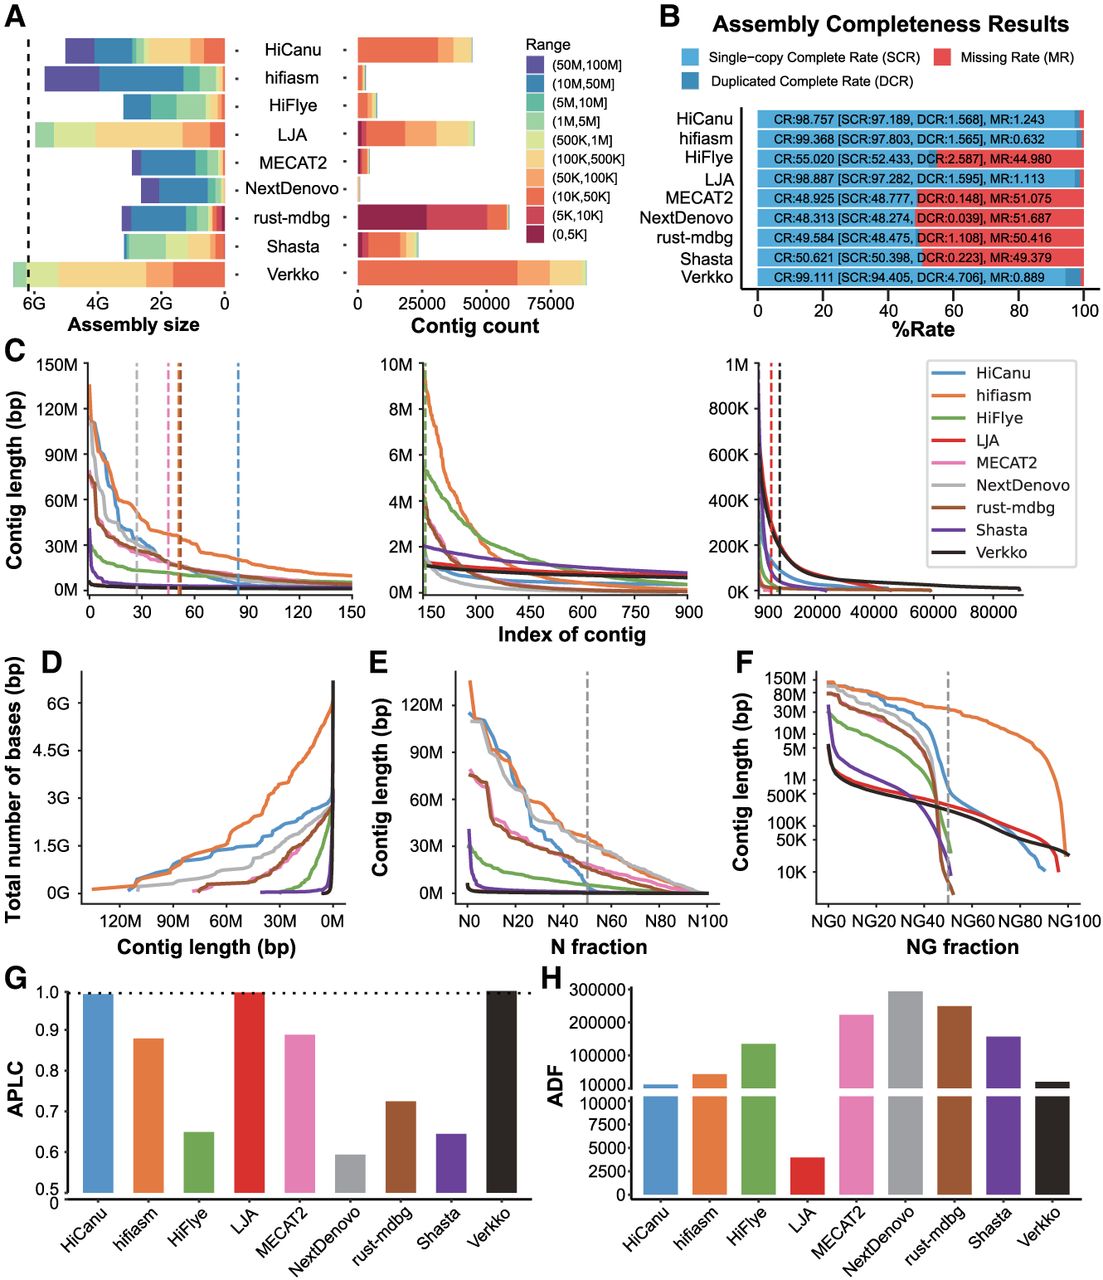
Summary of the performances of the selected genome assemblers on a human genome data set. (A) Cumulative total size of contigs (left) and the number of contigs (right) that have a size in the range encoded by the color in the legend; the vertical dashed line indicates the expected genome size. (B) Single-copy complete rate, duplicated complete rate, and missing rate. (C) Sorted contig length (left: longest 150; middle: index 150–900; right: index 900–80,000). (D) Cumulative assembly size as a function of the minimum contig length allowed in the assembly. (E) Nx length (the dashed line denotes the N50). (F) NGx length (the dashed line denotes the NG50). (G) Average proportion of largest category (APLC); the horizontal dashed line is APLC = 0.99. (H) Average distance difference (ADF).


