
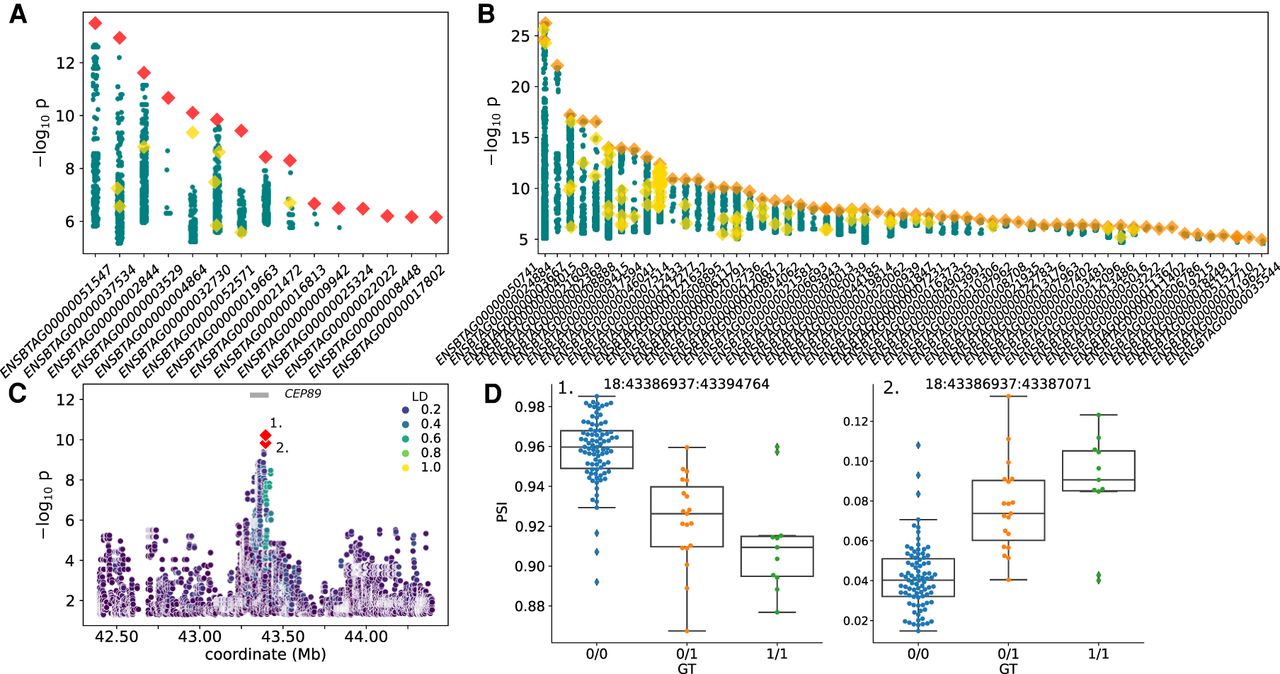
Figure 5.
cis-sQTL mapping. (A) Fifteen independent sGene cluster signals with SVs as the unique-top variant and (B) 58 SVs as top variants in LD with small variants, with the color and marker meanings as described in Figure 4. (C) Nominal association significance for CEP89, where the two red diamonds indicate the same variant affecting two separate junction splicings within the sQTL cluster. (D) Percentage spliced in (PSI) across the two significantly associated junctions (indicated by number from C) within the sQTL cluster.


