
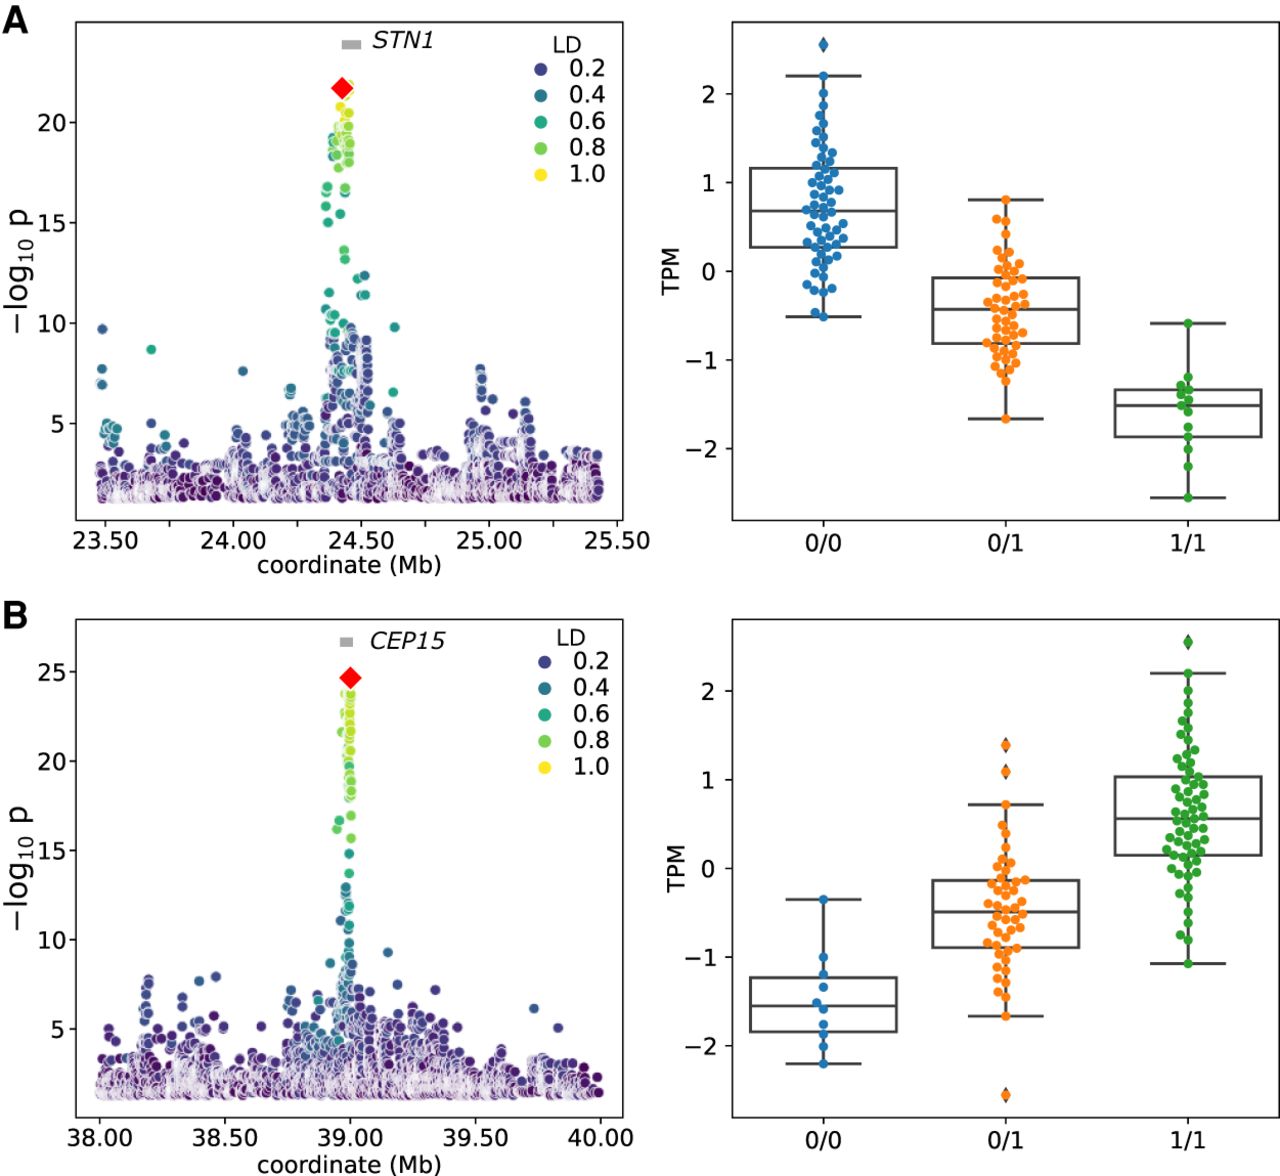
Figure 4.
Nominal eQTL association significance (left) and normalized TPM values for the expressed gene (right) for STN1 (A) and CEP15 (B). The red diamond represents the top-associated SV. Linkage disequilibrium (LD) between the SV and all other variants within the cis-window is indicated with the color gradient.


