
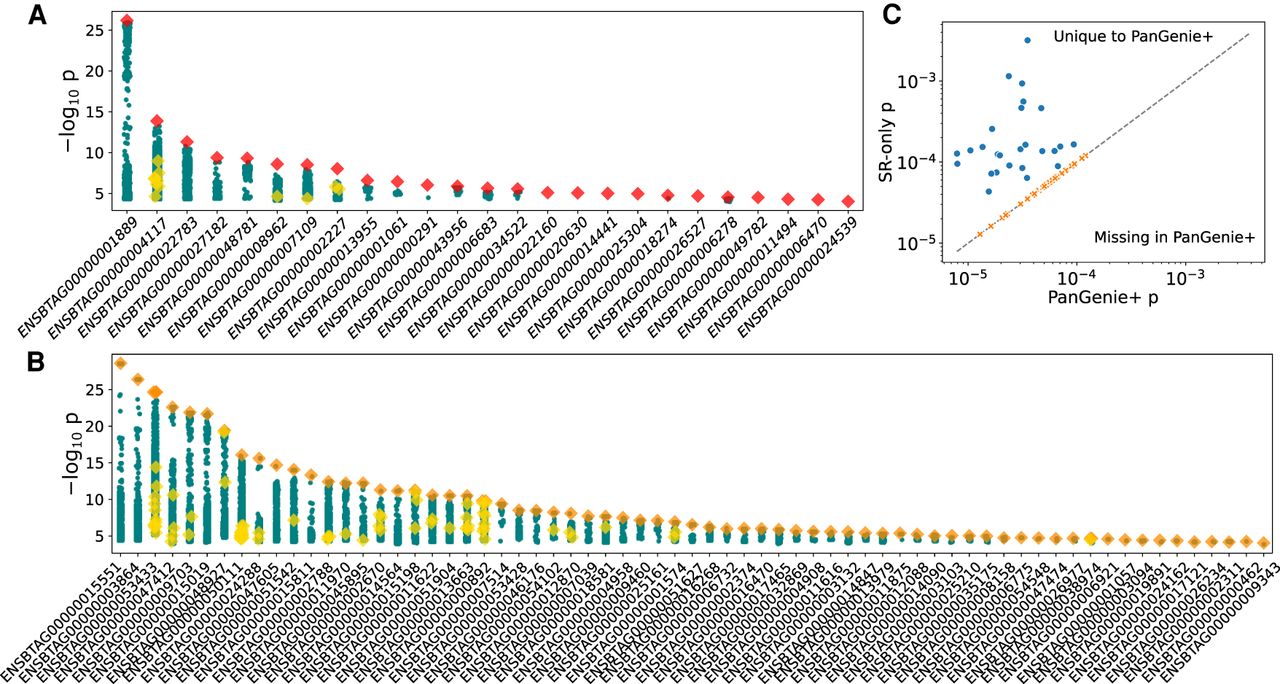
Figure 3.
cis-QTL mapping. (A) Twenty-five independent eGene signals with red diamonds denoting SVs as uniquely top hits. Other SVs are shown as yellow diamonds, and small variations are shown as teal circles. (B) Fifty-eight independent eGene signals with SVs as top hits in LD, with small variants denoted as orange diamonds and with yellow diamonds and teal circles as described in A. (C) eGenes that are present in only the PanGenie+ data set or the short-read-only DeepVariant data set. The dashed line indicates equal significance thresholds between the two conditional analyses.


