
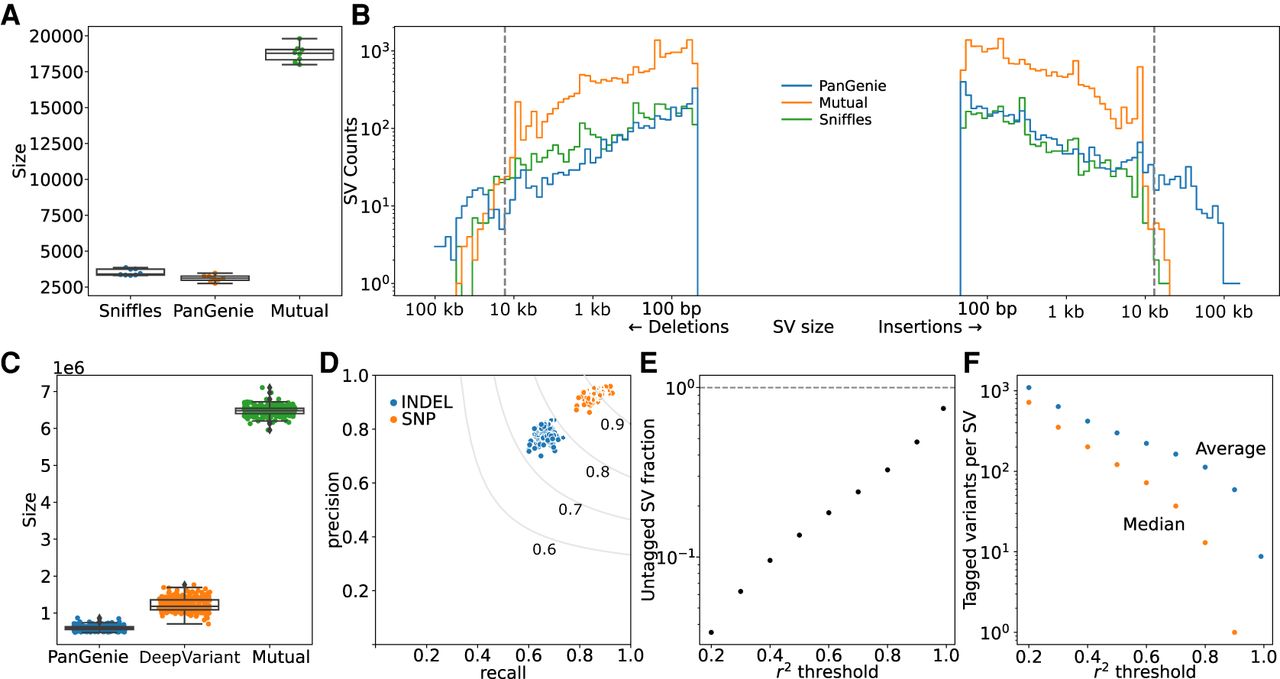
Concordance of variants genotyped by PanGenie. (A) SV overlap between PanGenie and Sniffles for the eight individuals used to create the pangenome variant panel. (B) SV size distribution for the groups in A. The gray dashed lines indicate 15 kb, the average read length for the HiFi reads used by Sniffles. (C) Small variant overlap between PanGenie-genotyped variants and DeepVariant-called variants for the 307 short-read samples. (D) Precision and recall for the 307 samples from C. The gray lines are the F-score boundaries for the indicated values. (E) Fraction of all SVs tagged by small variants at different thresholds of r2 within a linkage window of 1000 kb across the 307 samples. (F) Average and median number of variants that tag each SV across different r2 thresholds.


