
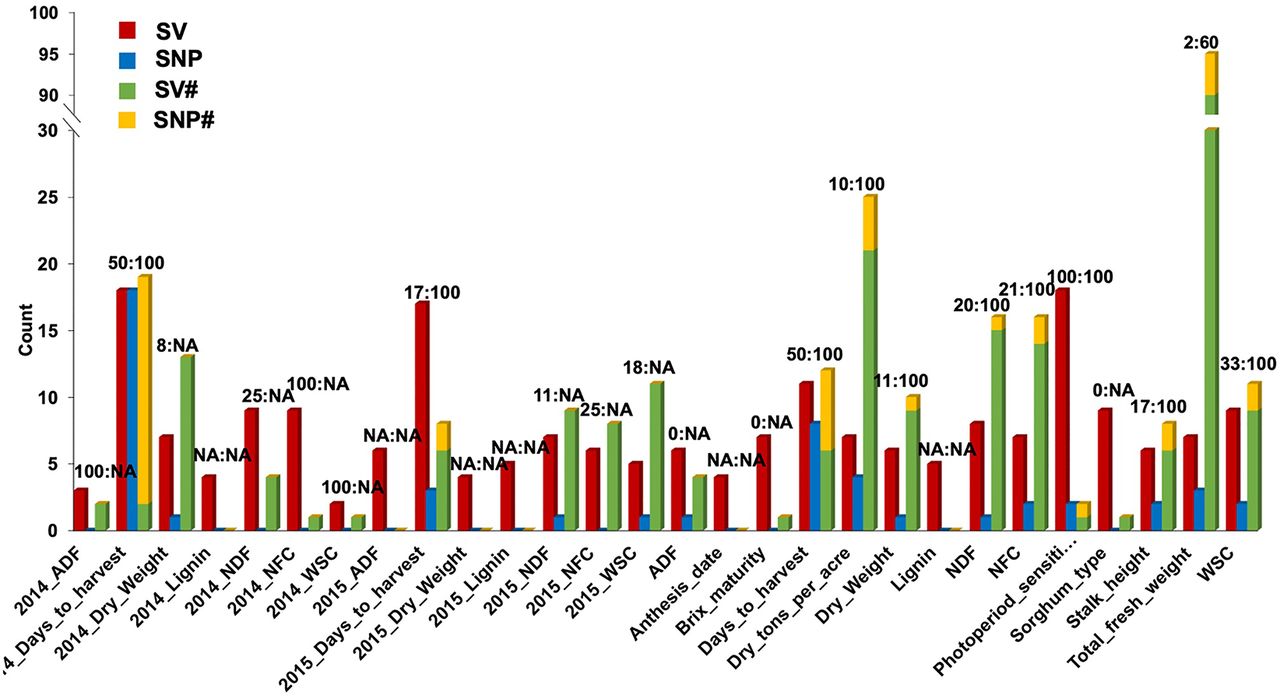
Number of significant genotype–phenotype associations detected in GWAS. Number of significant associations for 28 traits (there were 29 traits in total being analyzed, but there was no significant signal detected for “Brix_milk”) (Supplemental Table S10) detected in GWAS based on the SV (red columns, the first column per three column set), SNP (blue columns, the second column per three column set), and SNP + SV (the third stacked column per three column set, including both SVs [SV#, green] and SNPs [SNP#, orange]) data sets. (2014_ADF) Acid detergent fiber content in 2014, (2014_Days_to_harvest) days to harvest in 2014, (2014_Dry_Weight) dry weight of biomass in 2014, (2014_Lignin) lignin content in 2014, (2014_NDF) neutral detergent fiber in 2014, (2014_NFC) nonfibrous carbohydrates content in 2014, (2014_WSC) water-soluble carbohydrates content in 2014, (2015_ADF) acid detergent fiber content in 2015, (2015_Days_to_harvest) days to harvest in 2015, (2015_Dry_Weight) dry weight of biomass in 2015, (2015_Lignin) lignin content in 2015, (2015_NDF) neutral detergent fiber in 2015, (2015_NFC) nonfibrous carbohydrates content in 2015, (2015_WSC) water-soluble carbohydrates content in 2015, (ADF) average acid detergent fiber content of 2014 and 2015, (Anthesis_date) date of anthesis, (Brix_maturity) brix content in maturity stage, (Days_to_harvest) average days to harvest of 2014 and 2015, (Dry_tons_per_acre) dry tons per acre, (Dry_Weight) dry weight of biomass, (Lignin) lingnin content, (NDF) average neutral detergent fiber content of 2014 and 2015, (NFC) average nonfibrous carbohydrates content of 2014 and 2015, (Pericarp_pigmentation) pericarp pigmentation, (Photoperiod_sensitivity) photoperiod sensitivity, (Sorghum_type) sorghum variety type (sweet, grain, and cellulosic), (Stalk_height) stalk height, (Total_fresh_weight) total fresh weight, and (WSC) average water-soluble carbohydrates content of 2014 and 2015. Data labels on the top of each tripartite column set indicate the percentage of SVs (the value before the colon) and SNPs (the value behind the colon) detected in SNP + SV GWAS that were also detected in SV GWAS or SNP GWAS. (NA) There was no signal detected in SNP + SV GWAS. The number of identified signals in SNP GWAS was always the lowest compared with other data sets for all phenotypes. The detected SNP signals in SNP + SV GWAS mostly overlapped with the results of SNP GWAS. However, SVs detected in SV and SNP-SV GWAS were far from identical. This indicates that association analysis based on all three of the SNP, SV, and integrated SNP + SV data sets is necessary to dissect genetic mechanisms thoroughly.


