
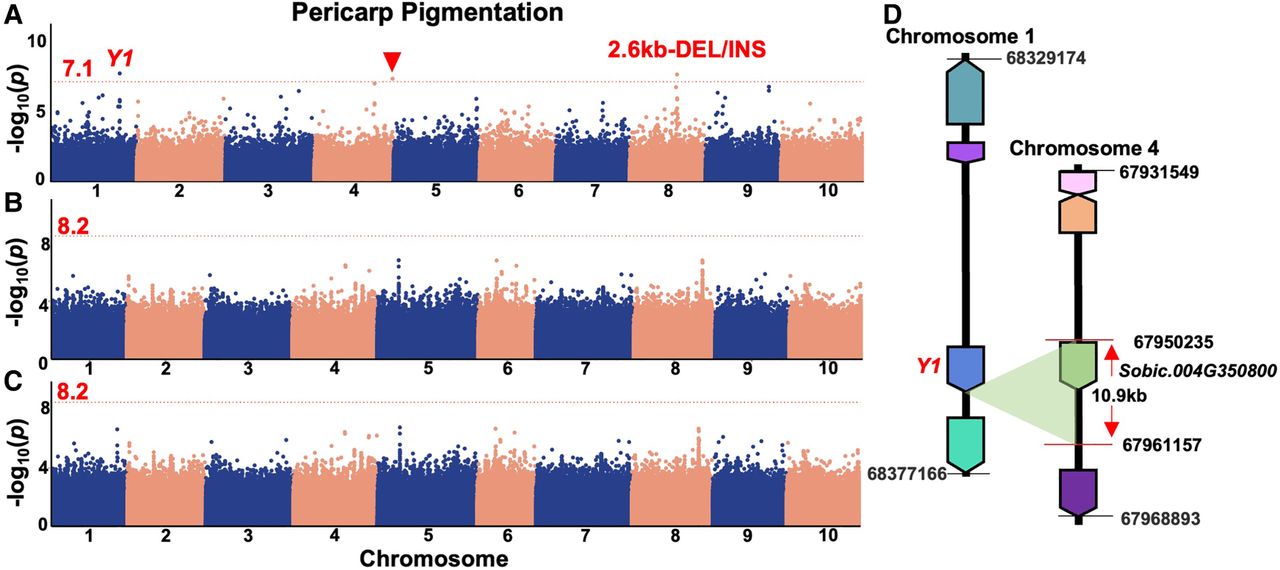
Manhattan plots of genome-wide association study (GWAS) results for “Pericarp Pigmentation.” (A) GWAS result for the pericarp pigmentation trait based on SVs alone. Three significant signals were detected using a compressed mixed linear model (CMLM) including a signal underlying the well-known pericarp pigmentation–related Y1 gene. The corresponding signal underlying the Y1 was a TRA variation between Chromosome 1 and Chromosome 4. The signal at the other breakpoint on Chromosome 4 of the TRA underlying Y1 was also detected (solid red inverted triangle). The signal on Chromosome 8 was a 2.6-kb DEL/INS located near TIM22-2 (Sobic.008G111800). (B,C) GWAS results for the “Pericarp_pigmentation” based on SNPs alone (B) and SNPs + SVs (C). The red dotted lines in the Manhattan plots show the Bonferroni-corrected threshold of α = 0.05. The red numbers near the red dotted lines were the corresponding values of the Bonferroni-corrected threshold of α = 0.05 based on different data sets; no loci reached the corrected significance threshold. (D) A diagram for the TRA underlying Y1. The corresponding signal underlying Y1 was a TRA with a ∼10.9-kb span including a coding gene (Sobic.004G350800) located on Chromosome 4 in the reference genome.


