
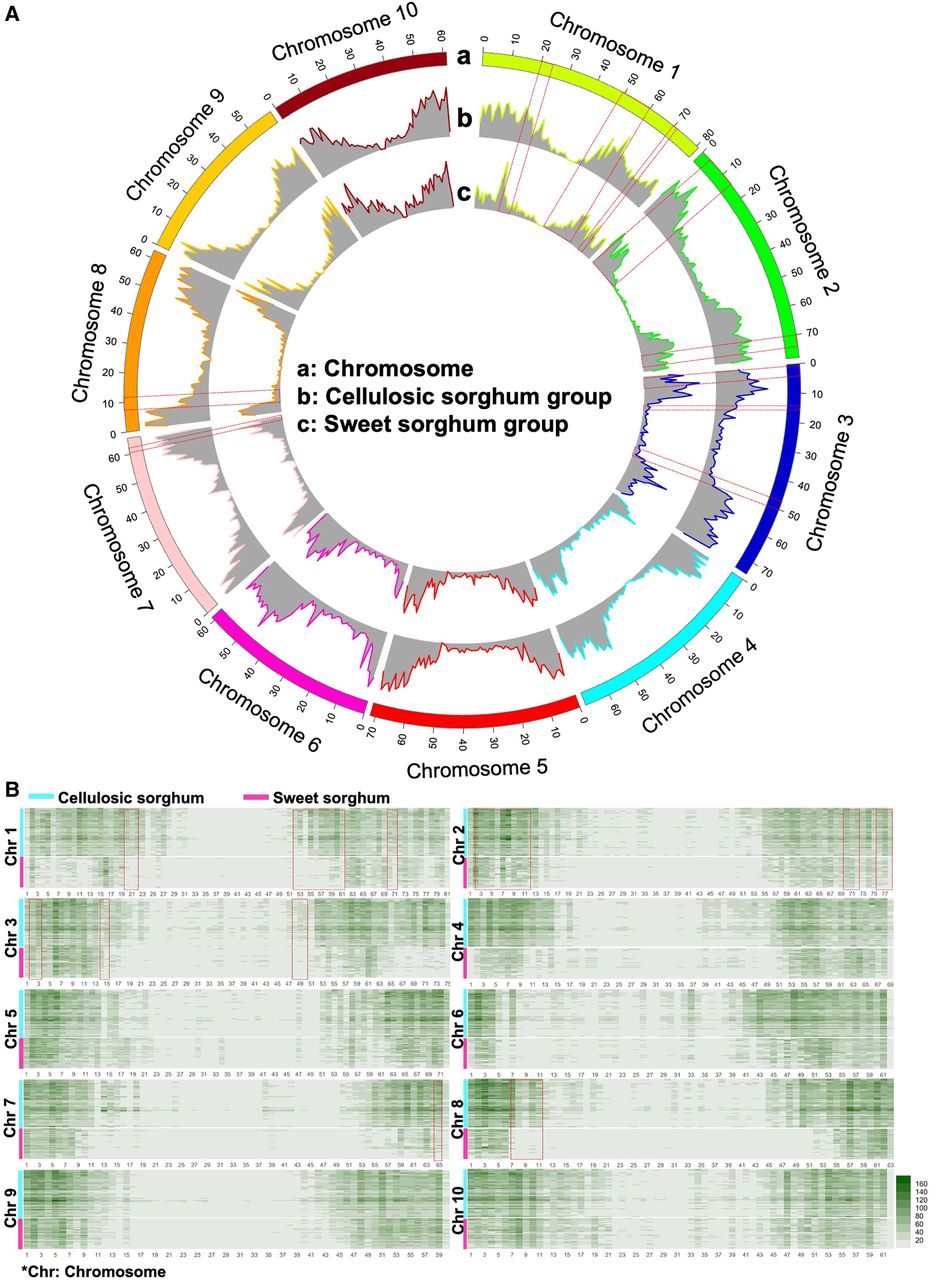
Typical SVs in the divergent evolution of cellulosic and sweet sorghum. (A) Circos (Krzywinski et al. 2009) plot for the SV frequency differences between the selected representative cellulosic sorghum group and the sweet sorghum group: (a) chromosomes, (b) SV frequency of cellulosic group, and (c) SV frequency of sweet group. SV frequencies were calculated in 1-Mb sliding windows in each group. Hypervariable genomic regions were observed between representative cellulosic and sweet sorghum groups. (B) Heatmap of SV frequency for selected representative cellulosic and sweet sorghum lines. SV frequencies were detected individually and chromosome by chromosome in 1-Mb sliding windows. The vertical axis stands for the stacked heatmaps for each sorghum line per chromosome. A cyan bar shows the range of the stacked heatmaps for cellulosic sorghum lines in each chromosome. A magenta bar shows the range of the stacked heatmaps for sweet sorghum lines in each chromosome. The x-axis stands for the physical distance for every chromosome. High SV detection frequencies were observed toward the telomeres in each chromosome for both the cellulosic group and sweet group. One hundred eighty-six out of 688 SVs frequency windows were tested as significant difference windows between representative cellulosic and sweet sorghum accessions. A red dash box indicates the hotspots previously reported covered by the 186 significant difference windows.


