
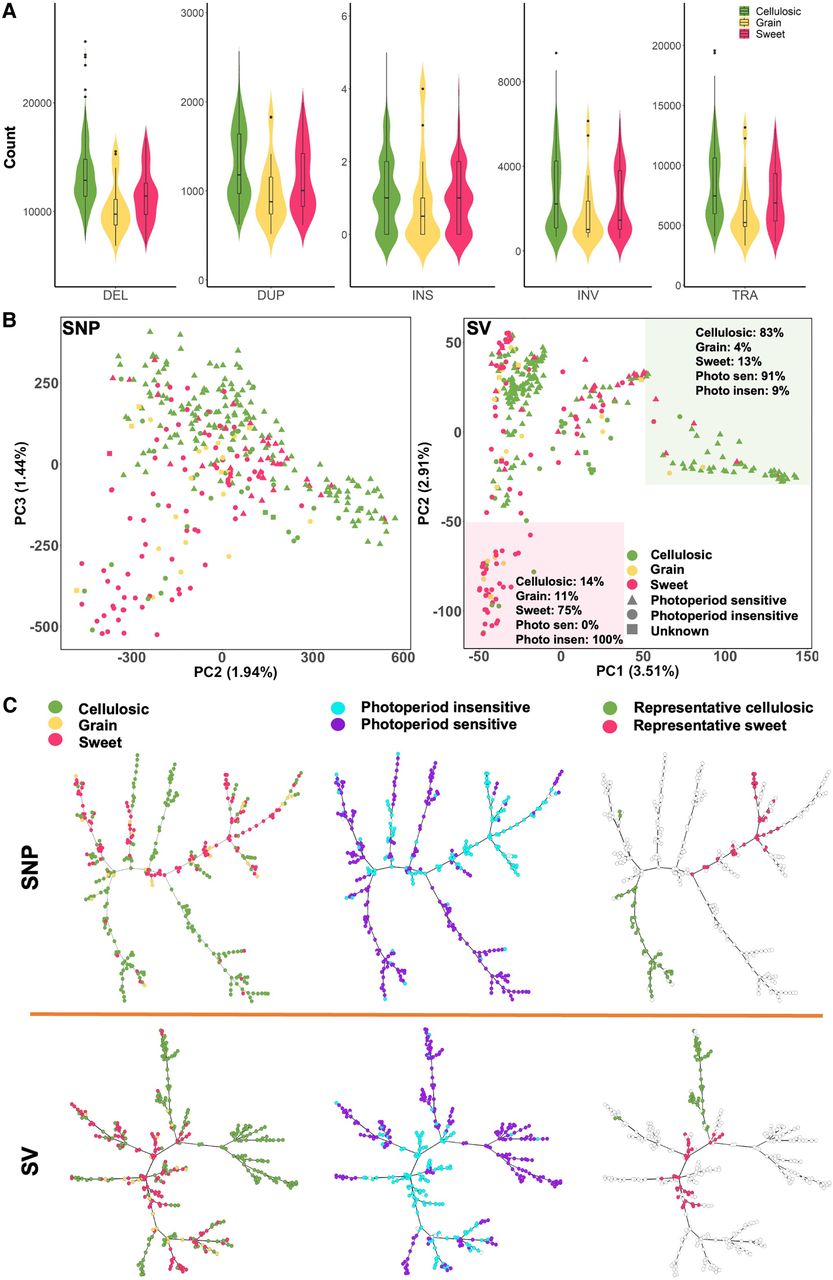
Structural variation (SV) distributions in different sorghum variety types and population structural analyses. (A) Violin and boxplot for SVs count distributions in cellulosic, grain, and sweet sorghum groups. DEL, DUP, INS, INV, and TRA count distributions were calculated separately in cellulosic (green, left), grain (yellow, center), and sweet (red, right) sorghum groups. Compared with the other two sorghum variety types, cellulosic sorghum contained the most called SVs, indicating that sweet sorghum may be closer to grain sorghum than cellulosic sorghum in SV content as the reference BTx623 is a typical grain sorghum. (B) Principal component analysis (PCA) based on SNP (left) and SVs (right). Photoperiod sensitivity—Photoperiod insensitive (circle), Photoperiod sensitive (triangle), and unknown (square)—and sorghum variety type information—cellulosic (green), grain (yellow), and sweet (red)—were differentiated by PCA based on SNPs and SVs. In SV PCA, the corner in the upper antidiagonal with the translucent green background shows the zones with PC1 > 50; the corner in the lower antidiagonal with the translucent red background shows the area with PC2 < −50. The percentages in both colored corners represent the proportions of different sorghums with the corresponding attributes. (C) Minimum spanning trees. Minimum spanning trees were shown based on both SNPs (top) and SVs (bottom). In the first column, sorghum variety type information is coded: cellulosic (green), grain (yellow), and sweet (red). In the second column, photoperiod-sensitivity information is coded: photoperiod insensitive (sky blue) and photoperiod sensitive (purple). In the third column, distribution of the selected representative cellulosic (green) and representative sweet (red) is shown from the PCA analysis. In general, sweet sorghum spreading branches matched those of photoperiod-sensitive sorghum lines, whereas cellulosic sorghum spreading branches matched those of photoperiod-insensitive sorghum lines and variety type.


