
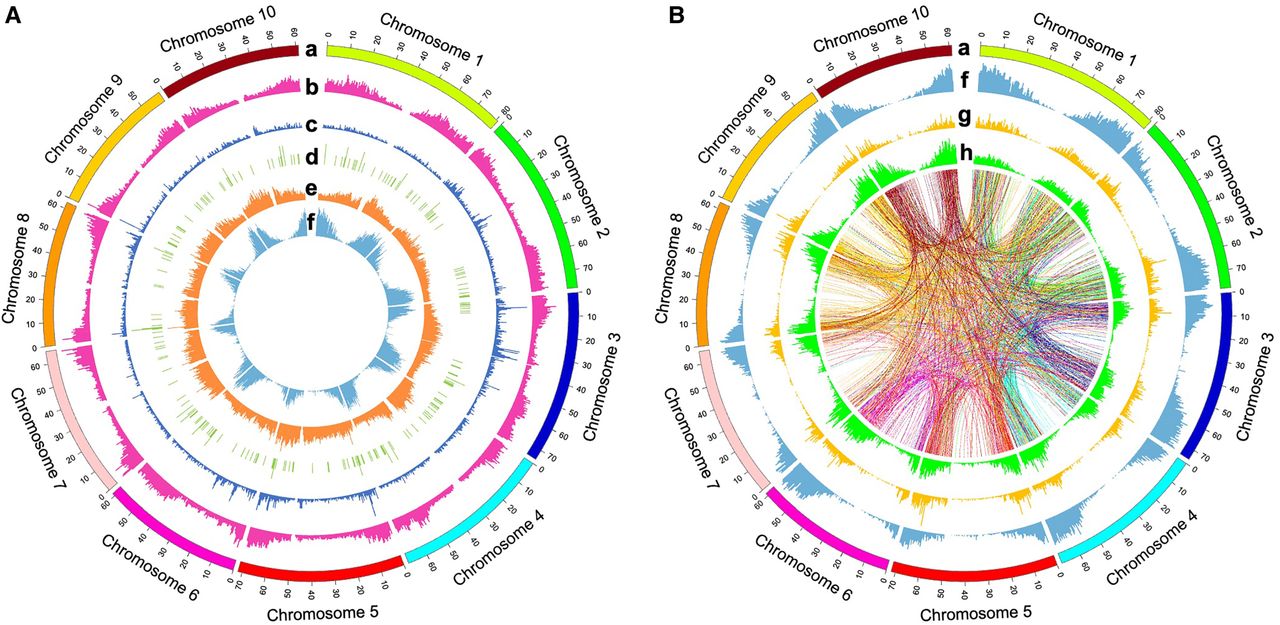
Distribution of genome-wide variations in the sorghum Bioenergy Association Panel (BAP). (A) Distribution of gene density and copy number variant (CNV) type structural variants (SVs), including deletions (DELs), duplications (DUPs), and insertions (INSs). From the outermost layer to the innermost layer of the Circos (Krzywinski et al. 2009) plot are chromosomes (a), DEL density (b), DUP density (c), INS density (d), single-nucleotide polymorphism (SNP) density (e), and gene density (f). Annotated genes were primarily located flanking centromeres as expected. Most of the identified SNPs were distributed in the gene-sparse regions. CNV-type SVs showed a different distribution pattern than did SNPs and were mainly situated in the gene-rich regions. The densities of the genes and CNV-type SVs were calculated in 500-kb windows. (B) Distribution of gene density and rearrangement (REA)-type SVs, including inversions (INVs) and translocations (TRAs). From the outermost layer to the innermost layer of the Circos plot are chromosomes (a), gene density (f), INV density (g), and TRA density (h). The core of the Circos plot is a spanning diagram of the identified TRAs. The links show the two breakpoints located in different chromosome positions for each TRA. Each link is colored by the chromosome color of the start position of the corresponding TRA. As with CNV-type variations, identified INVs and TRAs were distributed mainly in gene-enriched zones. Frequent rearrangement flows were observed between chromosomes. The densities of the genes and REA-type variants were calculated in 500-kb windows. The link diagram was evenly thinned (1/256) from the total TRAs.


