
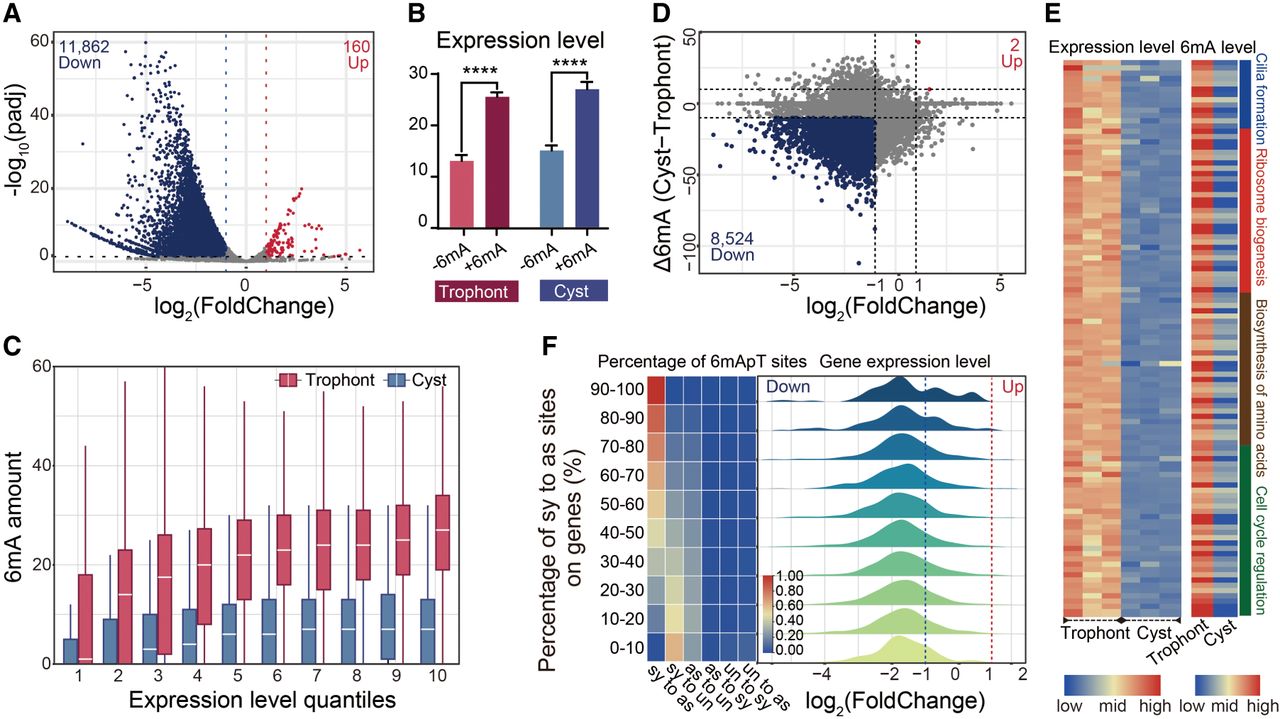
The active transcriptional mark 6mA correlates with gene expression alterations. (A) Global transcriptome analysis in trophonts and cysts based on spike-in RNA-seq data. Differentially expressed genes (DEGs) are highlighted (log2(FoldChange) ≥ 1 or ≤−1, P ≤ 0.05; down-regulated in blue and up-regulated in red). (B) Statistical analysis of expression levels (FPKM) of genes with 6mA (+6mA) or without 6mA (−6mA) was performed for trophonts and cysts, respectively. (****) P < 0.0001 (Student's t-test). (C) 6mA amount in genes with different expression levels in trophonts and cysts. Genes are ranked from low to high by their expression levels (FPKM) and divided into 10 quantiles. (D) Plots of log2(FoldChange) and Δ6mA. Genes with up-regulated expression (log2(FoldChange) ≥ 1) and up-regulated 6mA (Δ6mA ≥ 10) are highlighted in red. Genes with down-regulated expression (log2(FoldChange) ≤ −1) and down-regulated 6mA (Δ6mA ≤ −10) are highlighted in blue. Δ6mA was defined as the 6mA site number in cysts minus 6mA in trophonts. (E) Correlation between expression (left) and 6mA (right) levels of genes associated with encystment. (F) All possible 6mApT conversions from trophont to cyst were counted in each gene: (sy to as) symmetric to asymmetric, (sy to un) symmetric to unmethylated, (as to sy) asymmetric to symmetric, (as to un) asymmetric to unmethylated, (un to sy) unmethylated to symmetric, and (un and as) unmethylated to asymmetric. Genes were divided into 10 quantiles by their proportion of symmetric to asymmetric conversion in all 6mApT conversions, and the proportion of each 6mApT conversion is shown in a heatmap (left). (Right) Log2(FoldChange) distribution for each group of genes.


