
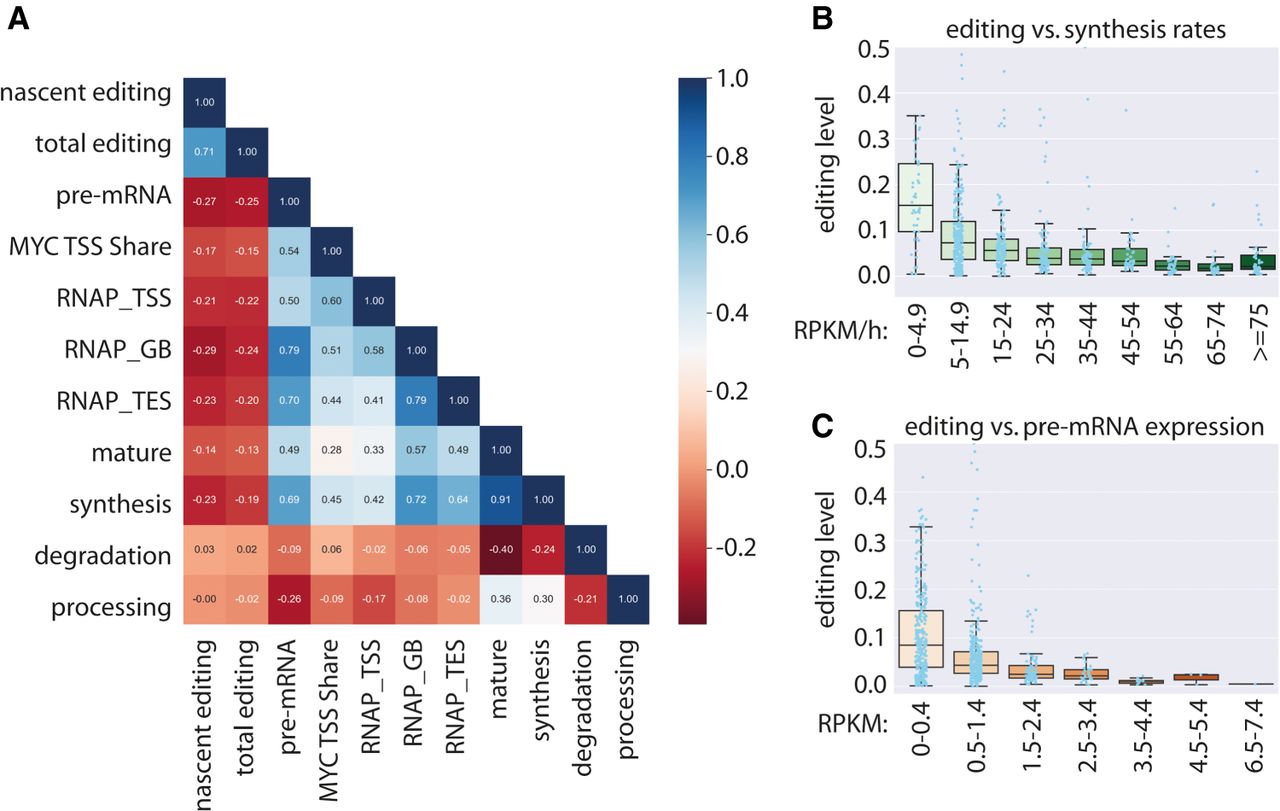
Low synthesis rates and pre-mRNA expression levels support higher editing levels. (A) Heatmap displaying correlation coefficients for nascent editing levels (nascent editing), total editing levels (total editing), pre-mRNA expression (pre-mRNA), MYC signal at transcription start sites (MYC TSS Share), RNA Pol II signal at transcription start sites (RNAP_TSS), gene body regions (RNAP_GB), transcription end sites (RNAP_TES), mRNA expression (mature), synthesis rates (synthesis), degradation rates (degradation), and processing rates (processing). (B,C) Nascent editing sites grouped according to synthesis rates (B) and pre-mRNA expression levels (C). Boxplots depict median editing levels and inter-quartile range. Light blue dots indicate individual editing sites. Individual editing sites above an editing level of 0.5 are not shown.


