
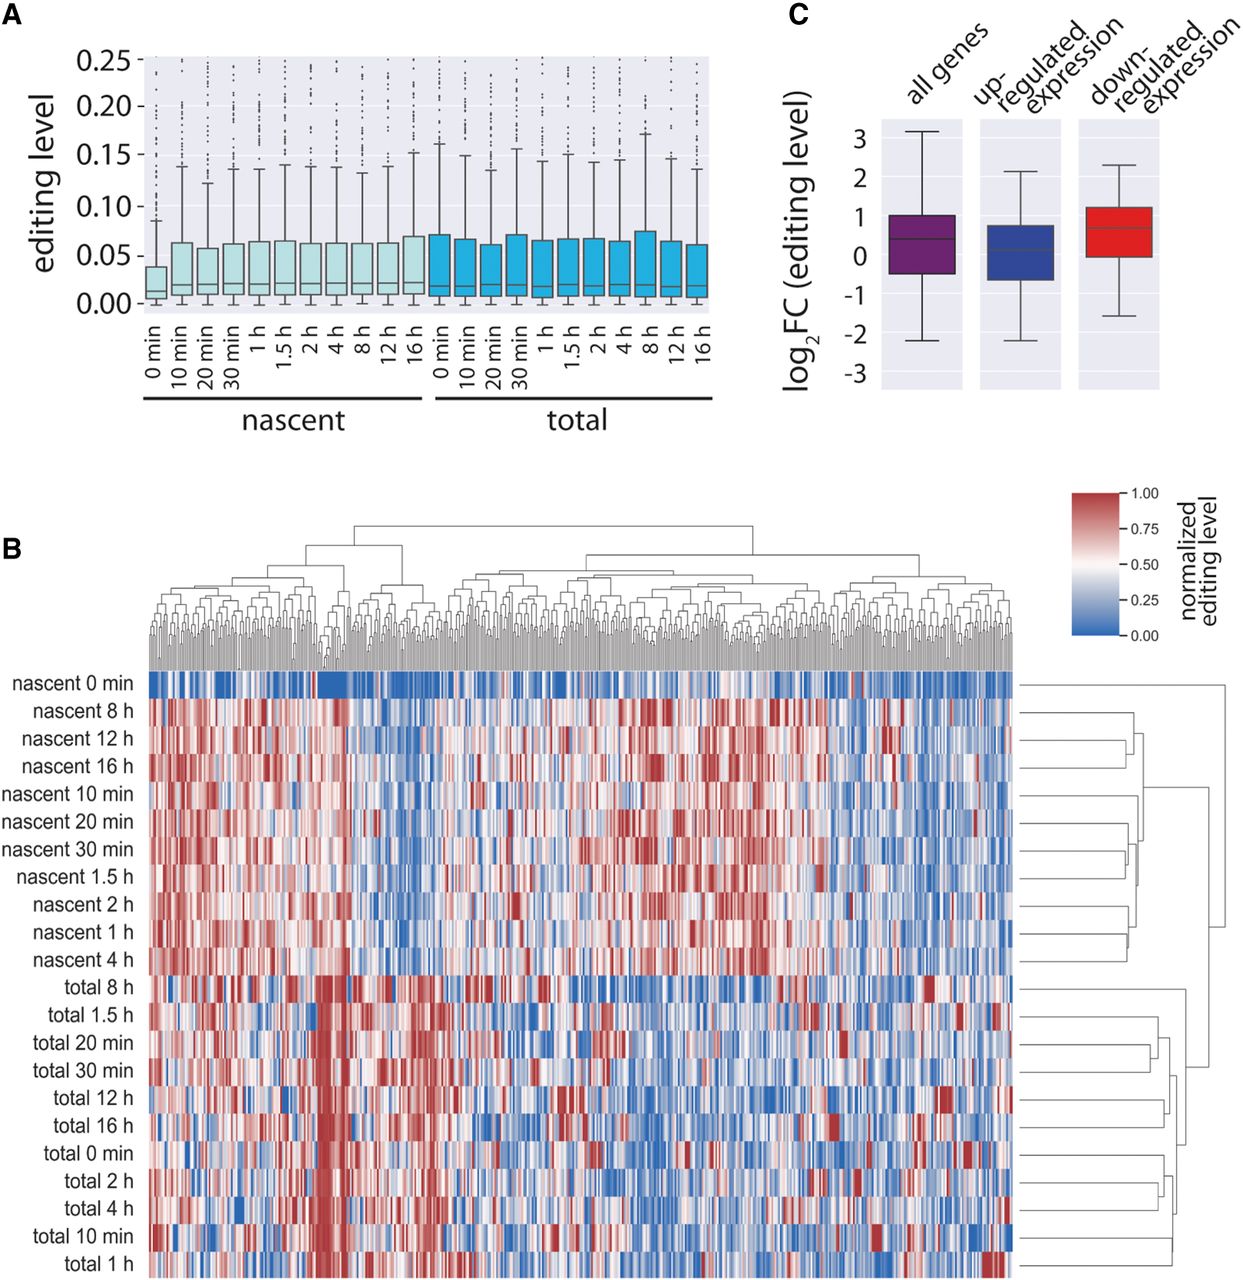
Analysis of editing in nascent and total RNA following activation of the transcription factor MYC reveals an up-regulation of editing levels upon MYC activation. Analysis of editing levels in a published data set in which nascent and total RNA were sequenced at 11 different time points following MYC activation. (A) Box plot showing median editing levels for all editing sites detected in the data set. (B) Editing levels were normalized across the entire time course and clustered using an unsupervised hierarchical clustering approach. Supplemental Table S2 shows all the editing sites sorted accordingly to the figure with individual gene names and editing site coordinates. (C) Log2 fold-change in editing levels between time point 0 min and 10 min after MYC activation for all the editing sites intersected with pre-mRNA expression data (all; purple). Those sites were split into sites associated with up-regulated (blue) or down-regulated (red) genes.


