
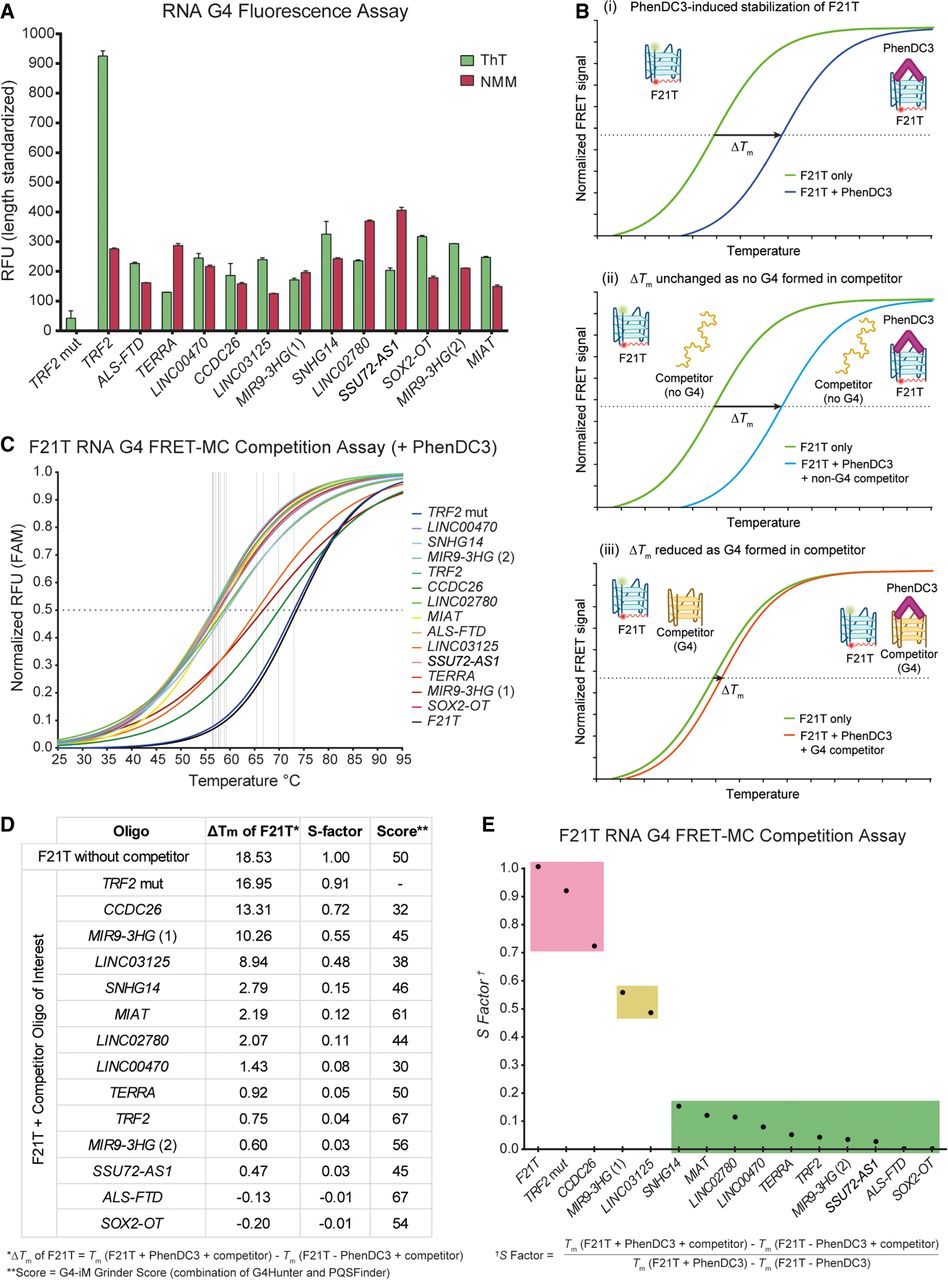
Fluorescence-based assays detecting G4 formation in lncRNA pG4 oligos. (A) ThT and NMM fluorescence normalized to sequence length. (B) Schematic of G4 FRET-MC experiment. (i) Initially, the F21T fluorescent G4 and nonfluorescent pG4 oligo (competitor) undergo a melt curve in the absence of the G4-stabilizing ligand, PhenDC3, and the Tm of the F21T G4 is determined. Next, the melt curve is performed in the presence of PhenDC3 to determine the ligand-induced stabilization of F21T, ΔTm. (ii) In the event that the competitor does not form a G4, the PhenDC3 ligand stabilizes the F21T G4, and the ΔTm remains unchanged. (iii) In the event of a G4 forming in the competitor, the PhenDC3 ligand stabilizes the competitor, and the ΔTm of the F21T is reduced. In all cases, only the Tm of the F21T fluorescent G4 is measured. (C) Nonlinear fit of normalized F21T melt curves ± competitor oligos with PhenDC3. Horizontal dotted line at y = 0.5, vertical dotted lines at Tm of F21T in each sample. (D) Table showing ΔTm of F21T upon addition of PhenDC3 ± competitors, S-factor, and G4-iM Grinder score of samples. (E) S-factor analysis showing the relative PhenDC3-induced stabilization of F21T ± competitors. Samples with results positive for G4 formation highlighted in green, inconclusive or intermediate G4 formation highlighted in yellow, and negative for G4 formation highlighted in red.


