
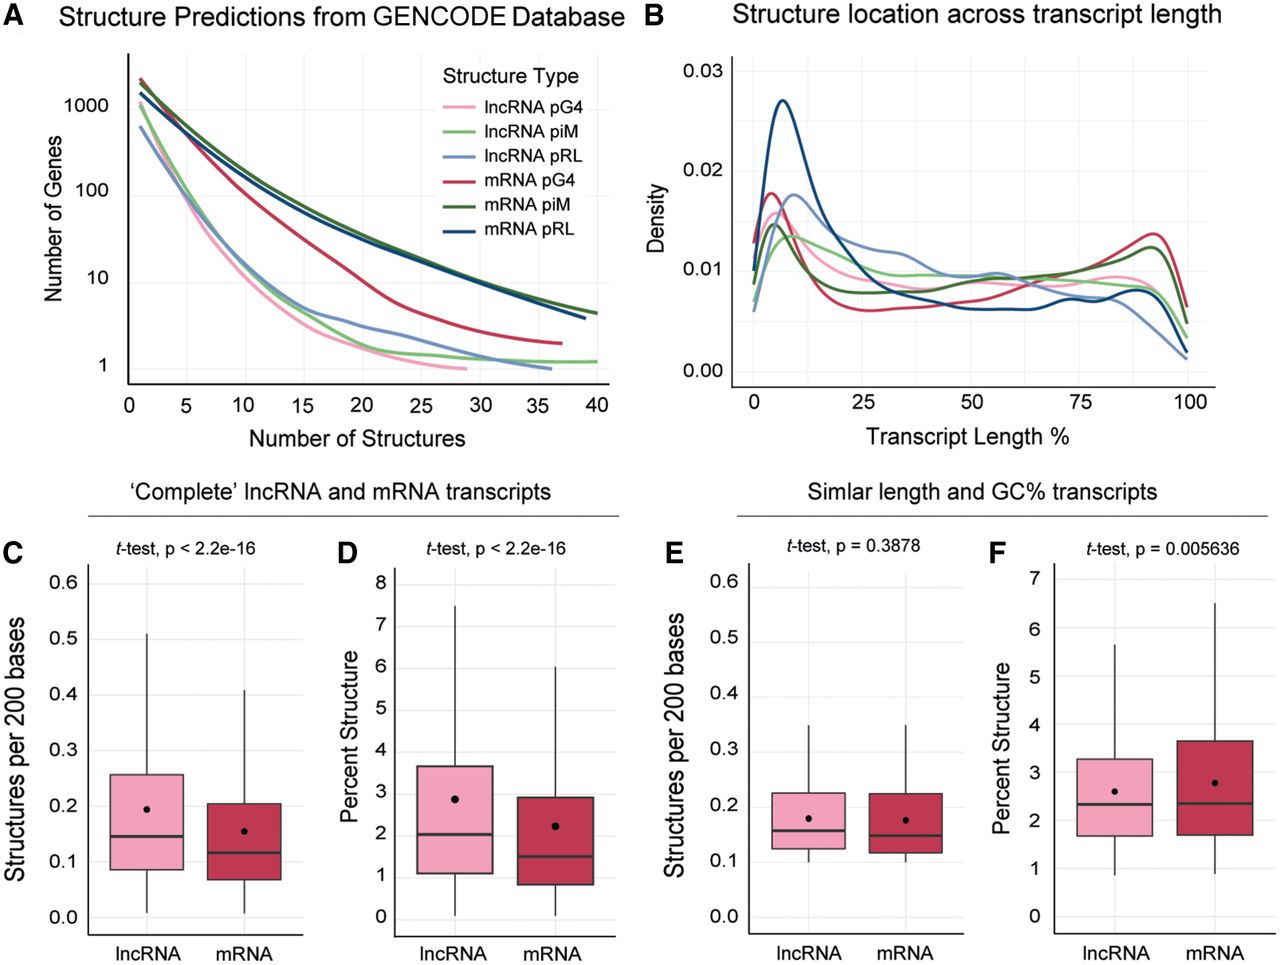
Comparisons between predicted structures in lncRNA and mRNA data sets. (A) Line graph showing the density of each structure in unique genes. The number of structures is limited to a maximum of 40 in a single gene for clarity (for full graph, see Supplemental Figure S1A). (B) Line graph showing the distribution of pG4, piM, and pRL structures across transcript length (5′ to 3′). Figure legend same as for panel A. (C,D) Boxplots showing the density of pG4s within the transcript (C) and the total percentage of the transcript consisting of pG4s (D) for the complete lncRNA and mRNA transcriptomes. Outliers removed for clarity, full graph in Supplemental Figure S1B,C. (E,F) Boxplots showing the density of pG4s within the transcript (E) and the total percentage of the transcript consisting of pG4s (F) for the lncRNAs and mRNAs with near-equivalent transcript length and GC content. For length standardization in C and E, the number of pG4/piM/pRL structures within a given transcript was divided by the transcript length to get the number of structures per base and then multiplied by 200. The number of bases used here is arbitrary and does not affect comparisons made between lncRNA and mRNA data sets.


