
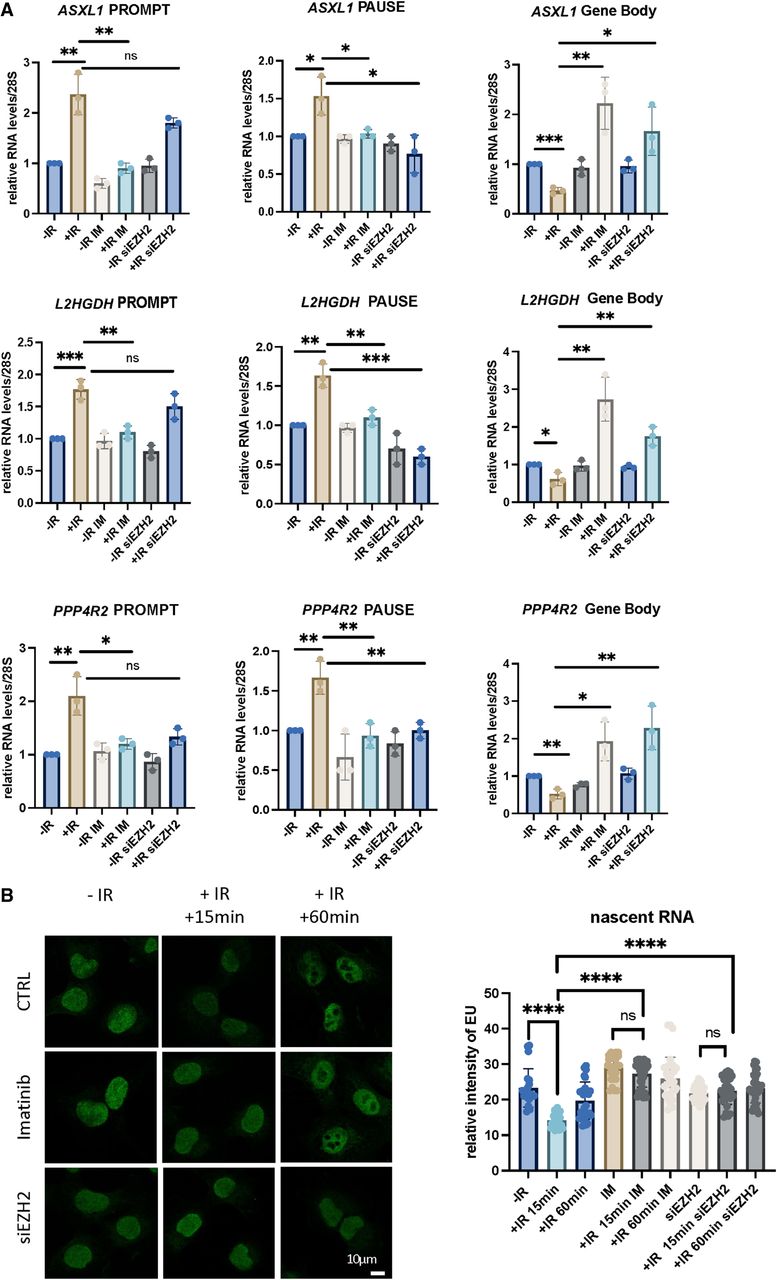
Figure 6.
PROMPTs and PRC2 facilitate down-regulation of PCGs upon DNA damage. (A) Bar charts showing RT-qPCR analysis of PROMPT-, PAUSE-, and GB-derived RNA at three selected genes. An unpaired t-test was used to assess statistical significance. (*) P < 0.05, (**) P < 0.01, (***) P < 0.001. (B, left) Representative images showing EU staining of nascent RNA in cells exposed to IR. (Right) A bar chart showing the quantification of images on left. A Mann–Whitney U test was used to compute statistical significance for difference in foci count: (****) P < 0.0001.


