
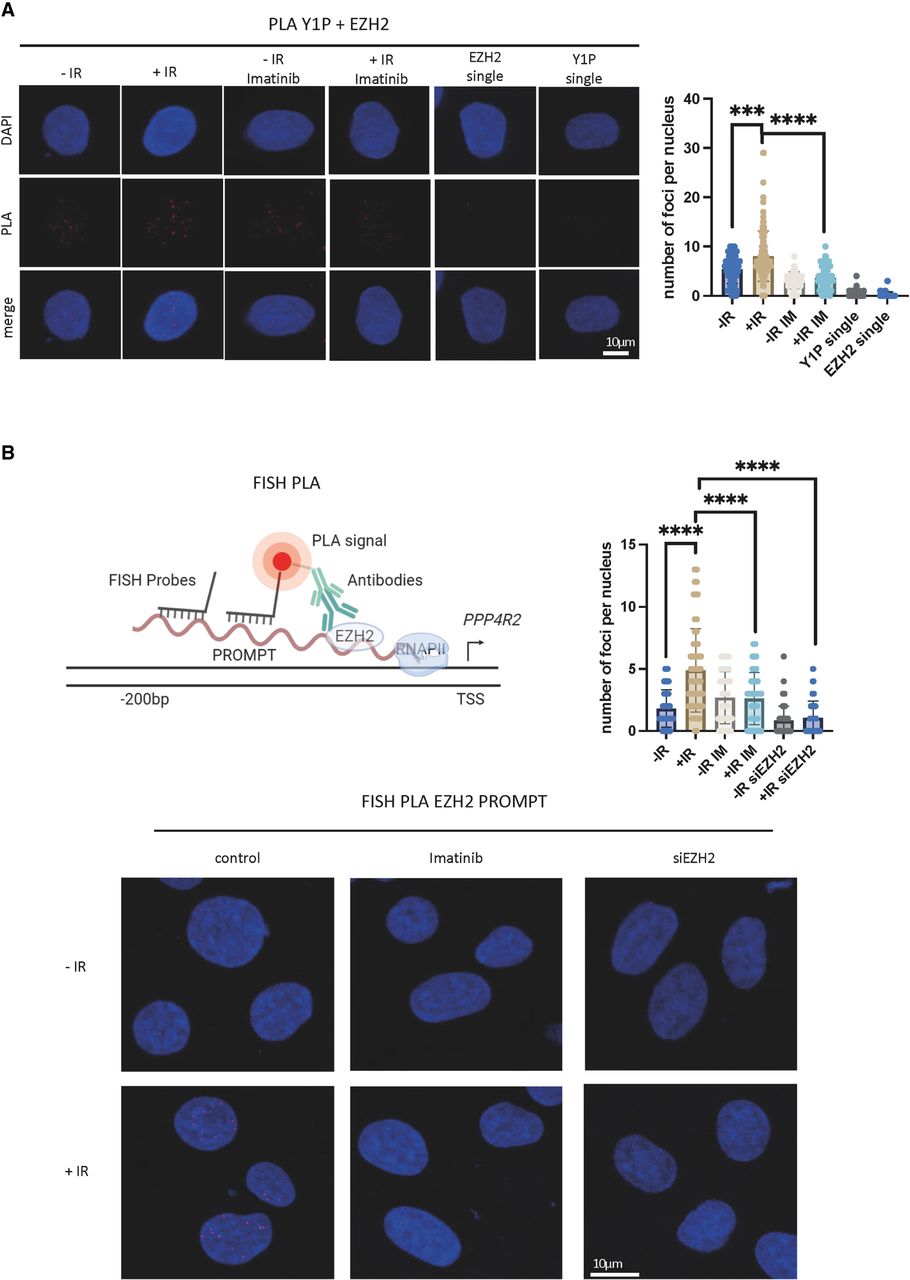
PRC2 is in close proximity to Y1P RNAPII and PROMPTs upon DNA damage. (A, left) Representative images showing PLA foci of Y1P and EZH2 in presence or absence of imatinib (1 μM, 1 h) in IR (10 Gy, 10 min) or no-IR conditions. n(no IR) = 126, n(IR) = 113, n(no IR + imatinib) = 104, n(IR imatinib) = 75, n(EZH2 single) = 41, and n(Y1P single) = 52, where n denotes the number of nuclei used for quantification. (Right) Quantification of PLA. A Mann–Whitney U test was used to compute statistical significance for difference in foci count. (*) P < 0.05, (**) P < 0.01, (***) P < 0.001, and (****) P < 0.0001. (B, top left) Illustration showing principles of FISH-PLA. (Bottom) Representative images showing FISH-PLA foci in presence or absence of imatinib (1 μM, 1 h) in IR (10 Gy, 10 min) or no-IR conditions or in wt or EZH2-depleted cells. (Top right) Quantification of FISH-PLA images. A Mann–Whitney U test was used to compute statistical significance for difference in foci count. (****) P < 0.0001.


