
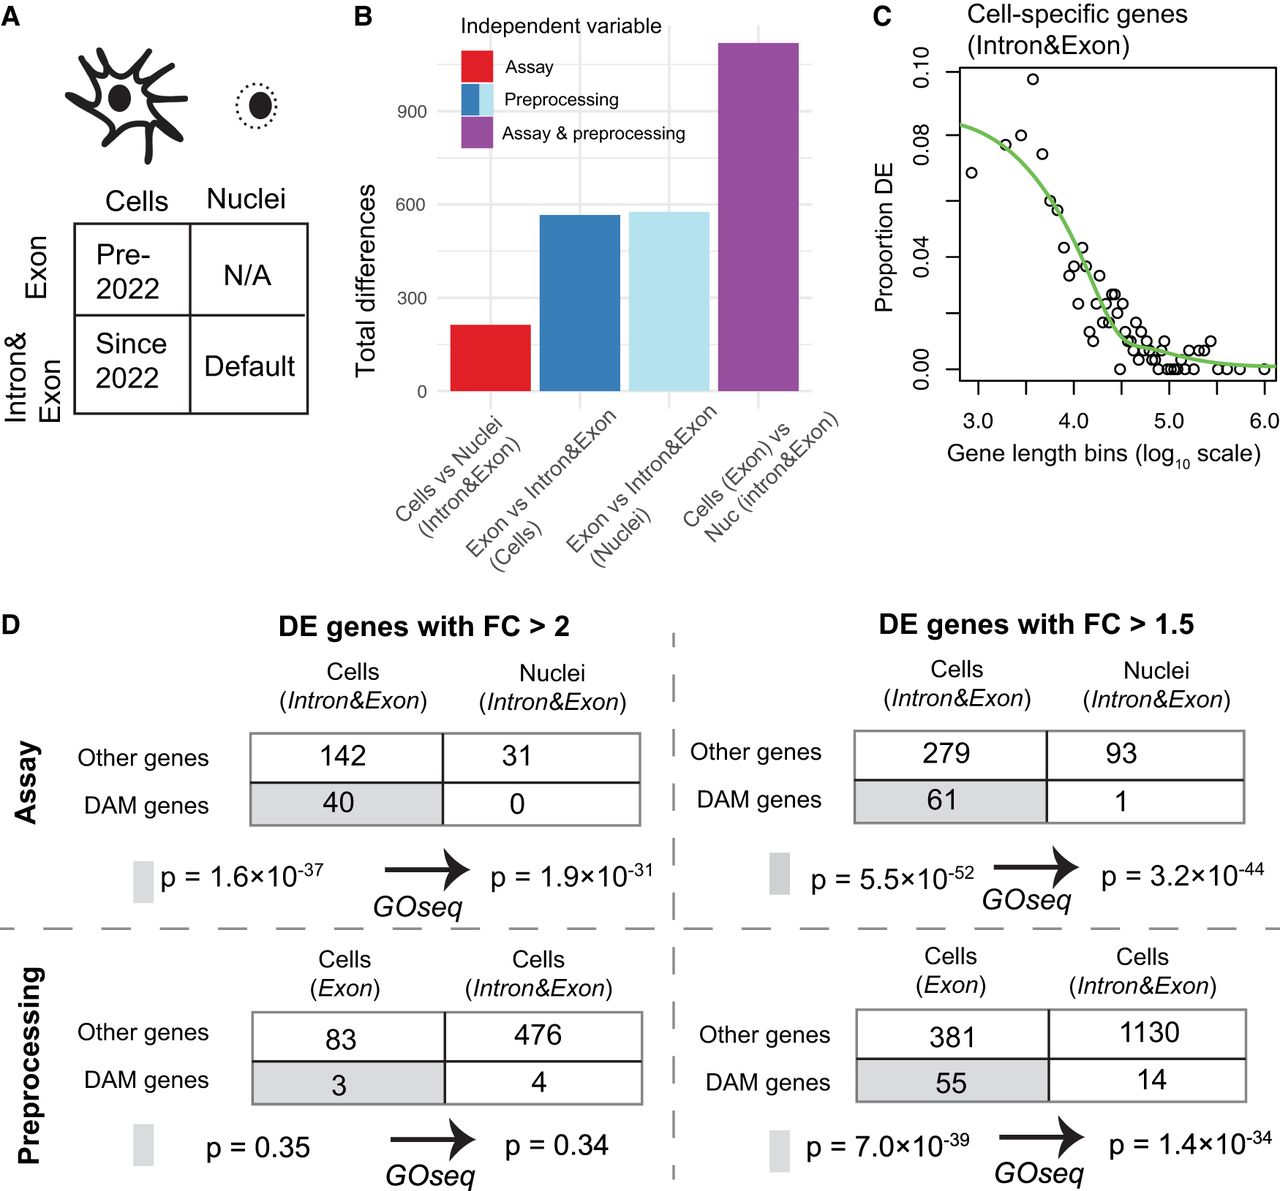
Impact of differential bioinformatic preprocessing on comparison within and between experiments. (A) Recommended bioinformatic processing of scRNA-seq and snucRNA-seq has converged over time according to CellRanger documentation. (B) The processing method (blue bars) has a larger effect on differential expression testing than does assay choice (red bar) in microglia. Historical paradigm in which nuclei and cells use two different processing methods maximizes apparent differences (purple). (C) GOseq analysis of genes significantly more abundant in microglial cells than nuclei with Intron&Exon quantification (FC > 1.5). Genes are grouped into bins of size 300 based on their length. Note that the correlation is negative in this instance because cell-specific genes are depicted rather than nucleus-specific genes. (D) GOseq analysis of genes significantly more abundant (FC > 1.5 or FC > 2) in response to a change in assay (top) or preprocessing (bottom). In either case, DAM genes are enriched at the FC > 1.5 threshold, and GOseq reduces but does not remove the strong statistical significance. At FC > 2, DAM genes are not significantly enriched in response to preprocessing.


