
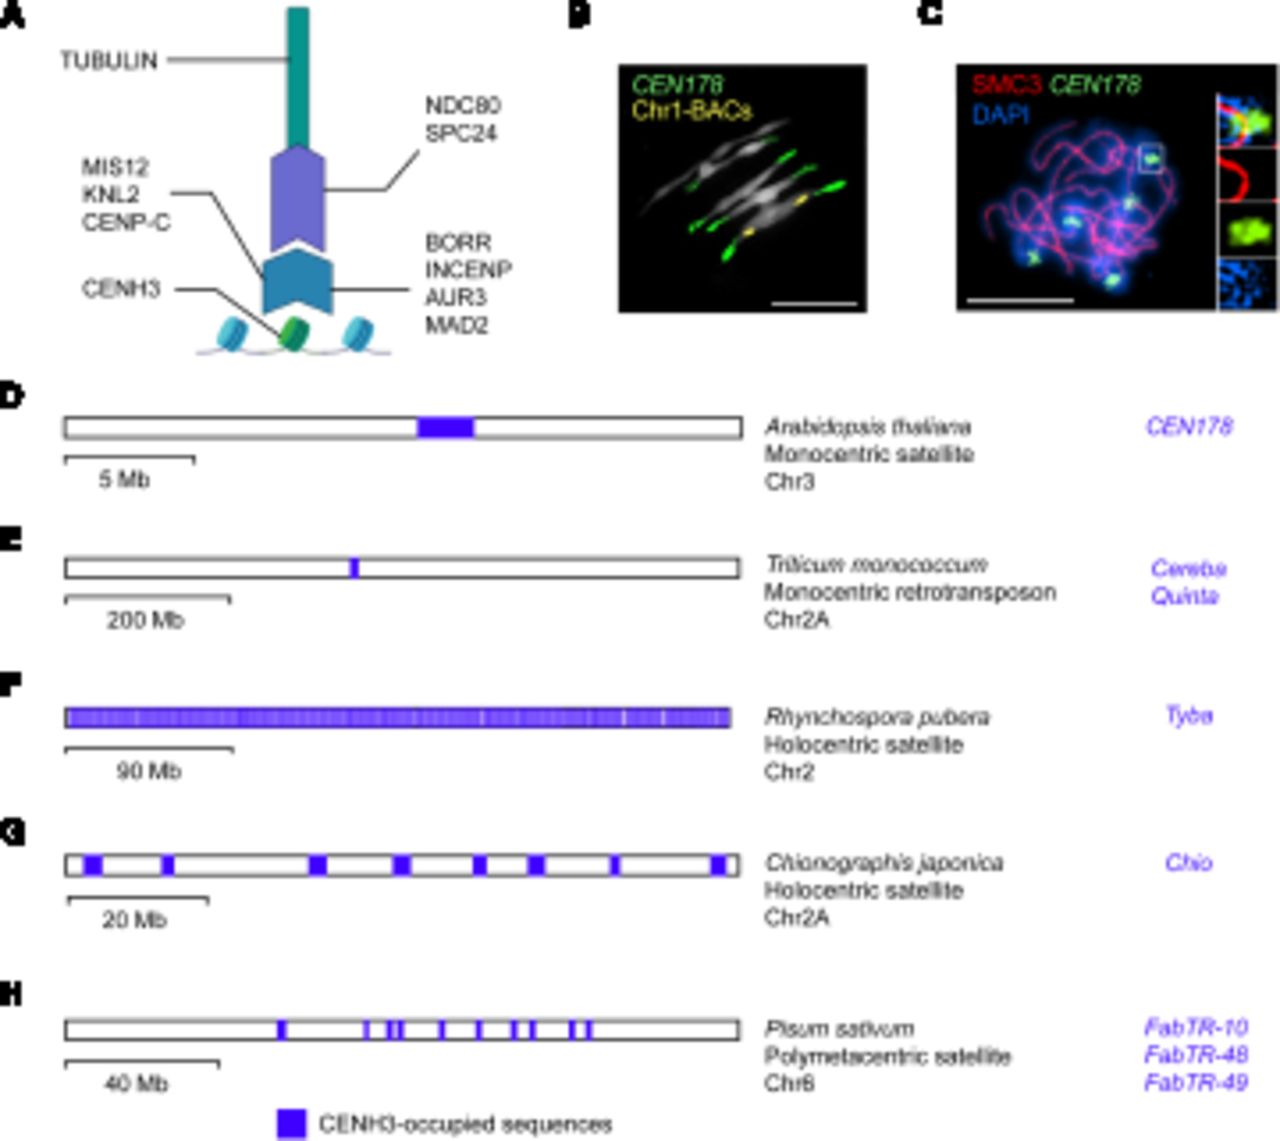
Plant kinetochores and centromere architecture. (A) A diagram of kinetochore structure highlighting known plant proteins, including CENH3 (Talbert et al. 2002), CENP-C (Dawe et al. 1999), MIS12 (Ravi et al. 2011), KNL2 (Lermontova et al. 2013), NDC80 (Du and Dawe 2007), SPC24 (Shin et al. 2018), MAD2 (Yu et al. 1999), AUR3 (Komaki and Schnittger 2017), INCENP (Komaki et al. 2020), and BOREALIN RELATED (BORR) (Komaki et al. 2020). (B) Representative cytological image of the A. thaliana chromosomes during segregation at metaphase (Naish et al. 2021). The DNA is stained with DAPI (white), together with FISH for the CEN178 centromere satellite sequences (green), and Chromosome 1 BAC sequences (yellow) (Naish et al. 2021). Scale bar, 10 μm. (C) Arabidopsis male meiocyte at pachytene stage immunostained for the SMC3 cohesin (red) and stained for DNA (DAPI; blue) (Lambing et al. 2020). FISH was performed against the CEN178 satellite sequence (green). Inset images show magnifications of a CEN178-positive region (Lambing et al. 2020). Scale bar, 10 μm. (D) Representing monocentric satellite architecture, a physical map of A. thaliana Chromosome 3 is shown, with the location of the CENH3-occupied CEN178 array highlighted in blue (Naish et al. 2021). The name of the CENH3-occupied sequences (CEN178) is written alongside in blue. A scale bar is provided indicating physical distance (megabases). (E) Representing monocentric retrotransposon architecture, a physical map of Triticum monococcum Chromosome 2A is shown (Ahmed et al. 2023), as in D. (F) Representing holocentric architecture, a physical map of Rhyncospora pubera Chromosome 2 is shown (Hofstatter et al. 2022), as in D. (G) Representing holocentric architecture, a physical map of Chionographis japonica Chromosome 2A is shown (Kuo et al. 2023), as in D. (H) Representing metapolycentric architecture, a physical map of Pisum sativa Chromosome 6 is shown (Macas et al. 2023), as in D.


