
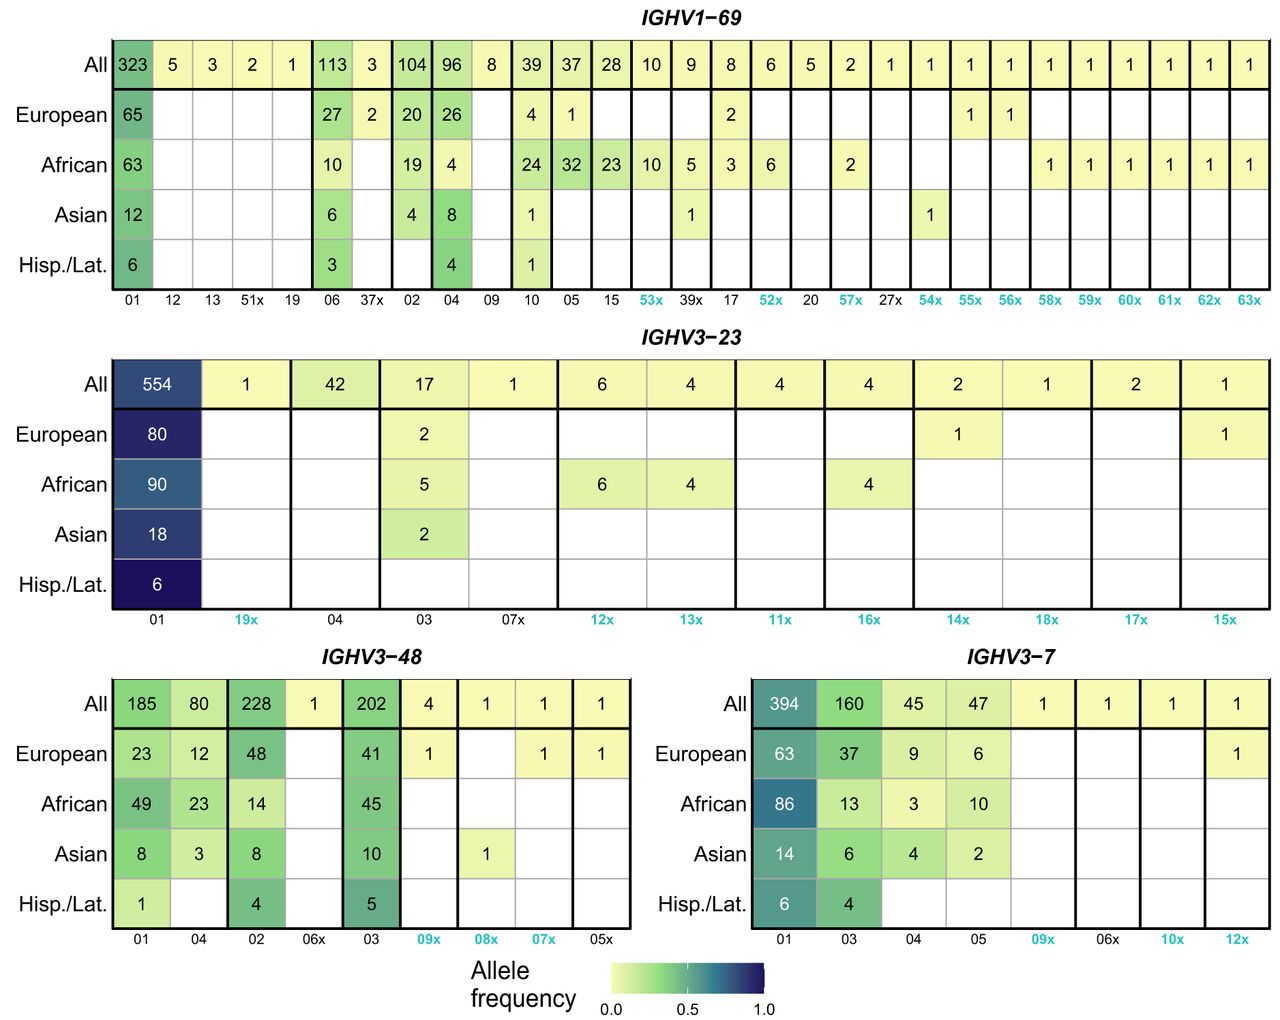
IGHV gene allele frequencies in major ethnic groups for selected IGHV genes. Each column in heatmaps represents a particular allele; numbers for novel alleles, first reported in this study, are colored in green; the letter “x” designates alleles inferred from AIRR-seq data, either in this study or previously, with the same sequences already present in OGRDB; bold lines separate groups of alleles with different amino acid sequences; groups of alleles with the same amino acid sequence are ordered by the aggregated frequencies of alleles; alleles within groups are order by allele frequency in the general population. Color represents the allele frequency within the ethnic group; numbers in cells represent the number of occurrences of the corresponding allele.


