
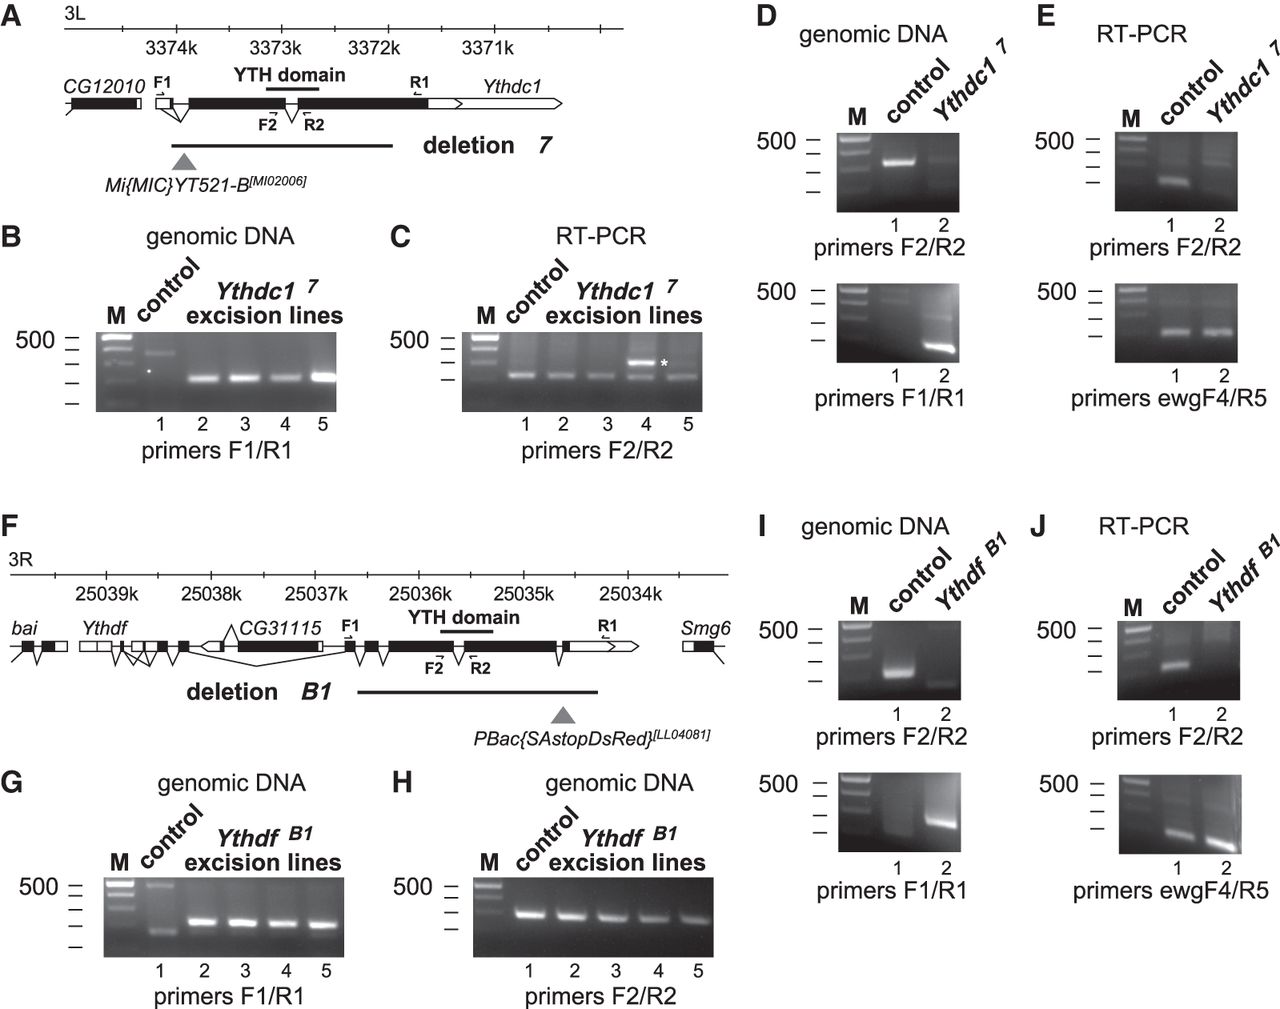
Generation of gene deletions in Drosophila YTH protein genes using two sgRNAs/Cas9 and transposon markers. (A) Schematic to the Ythdc1 locus indicating transcripts (white boxes) and the ORF (black boxes) below the chromosome. Primers used are indicated on top and below the transcripts. The w+ marked transposon used for detecting deletions in the locus is indicated by a triangle and the deletion generated is indicated by a line. (B) Agarose gels showing PCR products amplified from genomic DNA of control or Ythdc1 transposon excision lines using primers flanking the deletion. The presence of a PCR product indicates the expected gene deletion. DNA markers are indicated on the left. (C) Agarose gels showing RT-PCR products amplified from cDNA of control or Ythdc1 transposon excision lines using internal primers flanking an intron. Ectopic insertion in the opposite orientation is indicated by an asterisk (lane 4) as in this instance the transcript is not spliced. DNA markers are indicated on the left. (D) Agarose gels showing PCR products amplified from genomic DNA of control or Ythdc1Δ7 flies using internal primers and primers flanking the deletion. DNA markers are indicated on the left. (E) Agarose gels showing RT-PCR products amplified from cDNA of control or Ythdc1Δ7 flies using internal primers in Ythdf and ewg genes. The PCR product of the ewg gene was used as a loading control. DNA markers are indicated on the left. (F) Schematic to the Ythdf locus indicating transcripts (white boxes) and the ORF (black boxes) below the chromosome. Primers used are indicated on top and below the transcripts. The RFP-marked transposon used for detecting deletions in the locus is indicated by a triangle and the deletion generated is indicated by a line. (G) Agarose gels showing PCR products amplified from genomic DNA of control or Ythdf transposon excision lines using primers flanking the deletion. The presence of a PCR product indicates the expected gene deletion. DNA markers are indicated on the left. (H) Agarose gels showing PCR products amplified from genomic DNA of control or Ythdf transposon excision lines using primers flanking an intron. DNA markers are indicated on the left. (I) Agarose gels showing PCR products amplified from genomic DNA of control or YthdfΔB1 flies using internal primers and primers flanking the deletion. DNA markers are indicated on the left. (J) Agarose gels showing RT-PCR products amplified from cDNA of control or YthdfΔB1 flies using internal primers in Ythdf and ewg genes. The PCR product of the ewg gene was used as a loading control. DNA markers are indicated on the left.


