
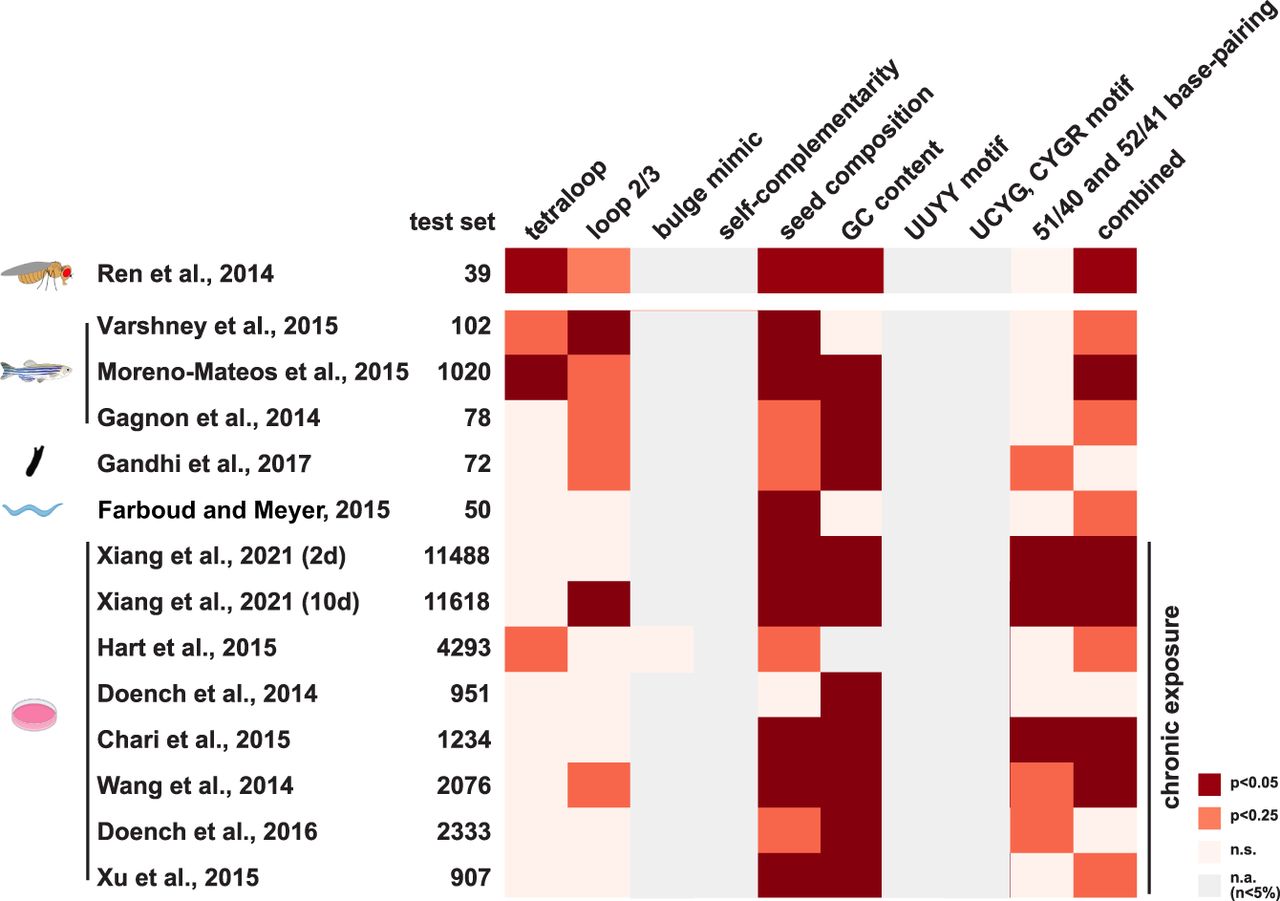
Figure 5.
Comparison of individual sgRNA selection criteria for performance with different data sets. The different data sets with the number of sgRNAs tested are indicated on the left. The different selection criteria are shown on top. Significant and enriched performances are indicated in red and orange, respectively (P < 0.05 and P < 0.25). Criteria with numbers below 5% are indicated in beige, and criteria already applied to the data set are shown in gray.


