
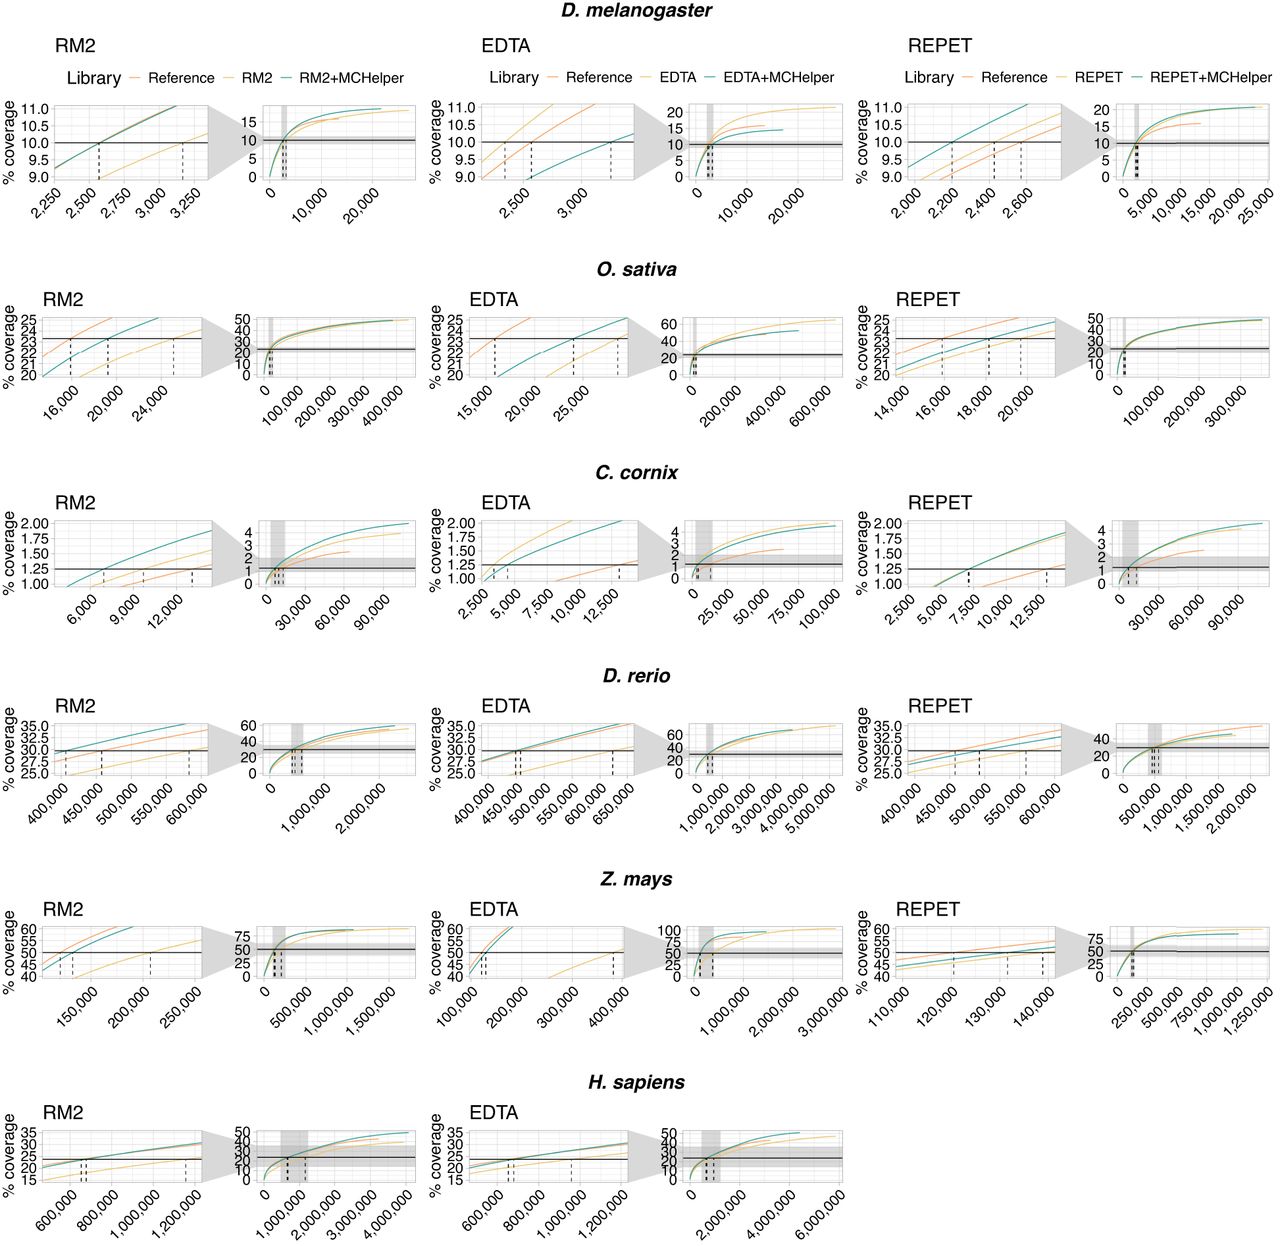
Cumulative length coverage plots for TE annotations in the six species analyzed. The black horizontal line represents half of the mobilome and it was used to calculate the LTE50 values (Table 1). The dashed vertical line indicates the NTE50 values. For each graph, a zoom capture is provided on the left to show when the cumulative length plot of each library crosses the black horizontal line (NTE50 values). Mobilome proportions are 20% in D. melanogaster (Mérel et al. 2020), 46.64% in O. sativa (Ou et al. 2019), 2.5% in C. cornix, 59.5% in D. rerio (Chang et al. 2022), and 47.68% in H. sapiens (Hoyt et al. 2022). In Z. mays, we used 50% of the full genome space to calculate the NTE50 and LTE50 as recommended by Jamilloux et al. (2017). NTE50 and LTE50 values are shown in Table 1.


