
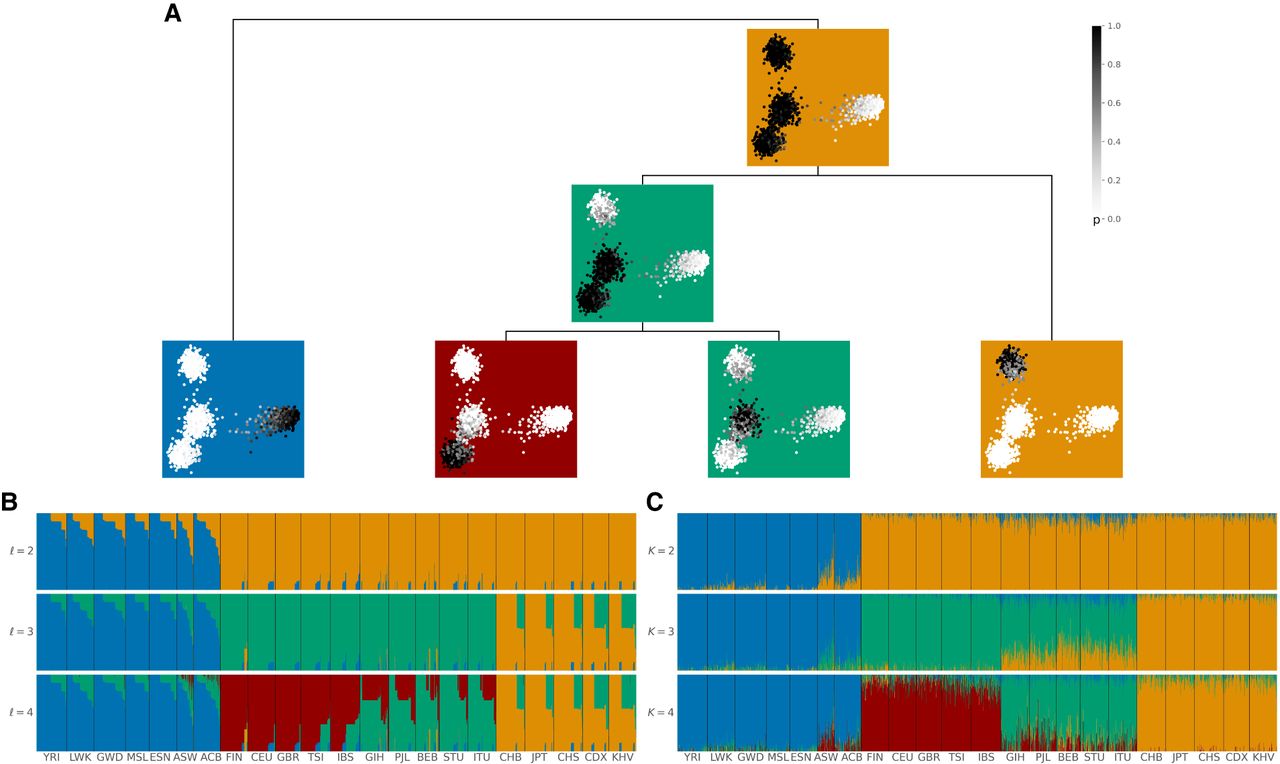
tangleGen's hierarchical soft clustering for the 1000 Genomes Project. Inferred ancestries by tangleGen (B) and ADMIXTURE (C) based on SNPs from Kidd's AIMs set for individuals sampled in the 1000 Genomes Project Phase 3, excluding AMR. (A) Soft clustering of tangleGen visualized with PCA for each individual and each split in the tangles tree. Panels at each split in the tangles tree show a PCA plot based on the AIMs set genotype matrix. Each individual is represented as a dot, with darker colors indicating higher confidence in the assignment of the individual to the corresponding cluster. The PCA visualization highlights that individuals positioned between two populations are softly clustered into both populations. The same soft clustering is processed in B into an ADMIXTURE like bar plot. The resulting soft clustering is hierarchical and the leaves of the tree can be assigned to the AFR (blue), EUR (red), SAS (green), and EAS (orange) superpopulations. (B) Soft clustering by tangleGen visualized in a bar plot. Each subplot corresponds to a level ℓ in the tangles tree, where the different levels result from splits in the tangles tree. tangleGen identifies the four superpopulations AFR, EUR, SAS, and EAS with a meaningful inferred hierarchical population structure. The first split is supported by nine characteristic SNPs, and the second and third by three characteristic SNPs each. Cost function as specified in Equation 2 with k = 40, and agreement parameter a = 225. (C) Ancestry proportions by ADMIXTURE. ADMIXTURE identifies the four superpopulations AFR, EUR, SAS, and EAS, when the number of populations is set to K = 4, but shows inconsistencies, compared to smaller values of K in the differentiation between the four populations. The best of 10 runs is shown in terms of the clarity of the inferred populations and minimization of inconsistencies compared to the underlying population structure. In B and C, the individuals are sorted within the populations in the same way such that a block structure for the tangleGen plot B is achieved. The four superpopulations are made up as follows: AFR: YRI, LWK, GWD, MSL, ESN, ASW, ACB; EUR: FIN, CEU, GBR, TSI, IBS; SAS: GIH, PJL, BEB, STU, ITU; and EAS: CHB, JPT, CHS, CDX, KHV. Results that include Admixed American (AMR) populations can be found in Supplemental Figure S2.


