
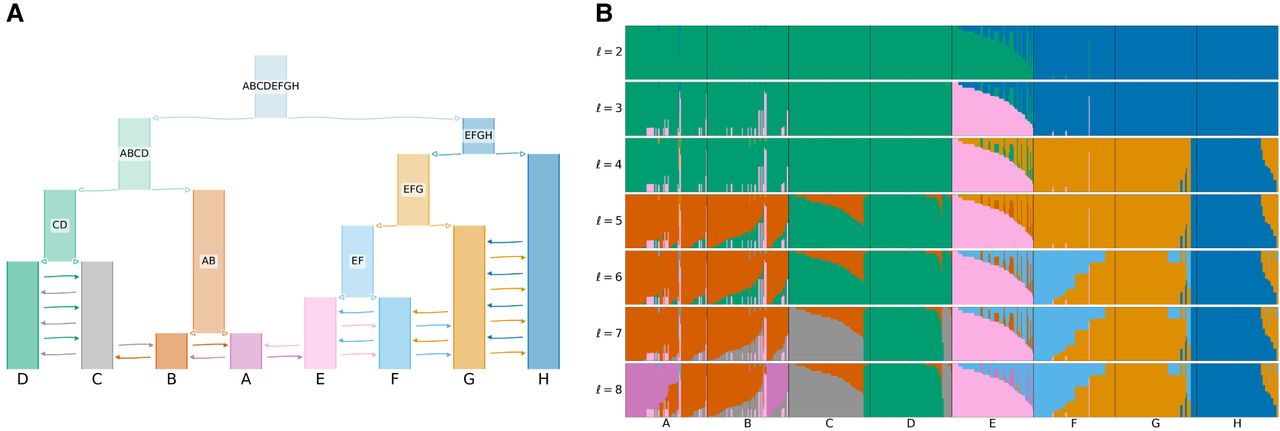
tangleGen on simulated data with many admixture events. (A) Underlying demographic structure in the simulation with migration added between populations A to H as indicated by the arrows. Migration rate is quadrupled in comparison to Figure 4A. See the Data simulation section in Methods for more details. (B) Soft clustering of tangleGen. Inferred ancestral relationships by tangleGen on simulated data with underlying demography as shown in A. The plot shows the soft clustering for different levels ℓ just as in Figure 4D. Note, that the maximal value of ℓ is a result of its hierarchical clustering in combination with the agreement parameter. tangleGen infers meaningful population structures even with an increased migration rate. Higher migration rates result in more admixed populations and the hierarchical nature of tangleGen shows the migration pattern clearly. Starting with the top split between the ancestral populations ABCDE and FGH, each split is based on 29, 11, 10, 36, 10, 4, and 3 characteristic SNPs. In contrast to Figure 4D, the agreement parameter is set to a = 30 and all external branches supported by only one SNP are pruned (pruning parameter equals 1), to account for the less differentiated populations.


