
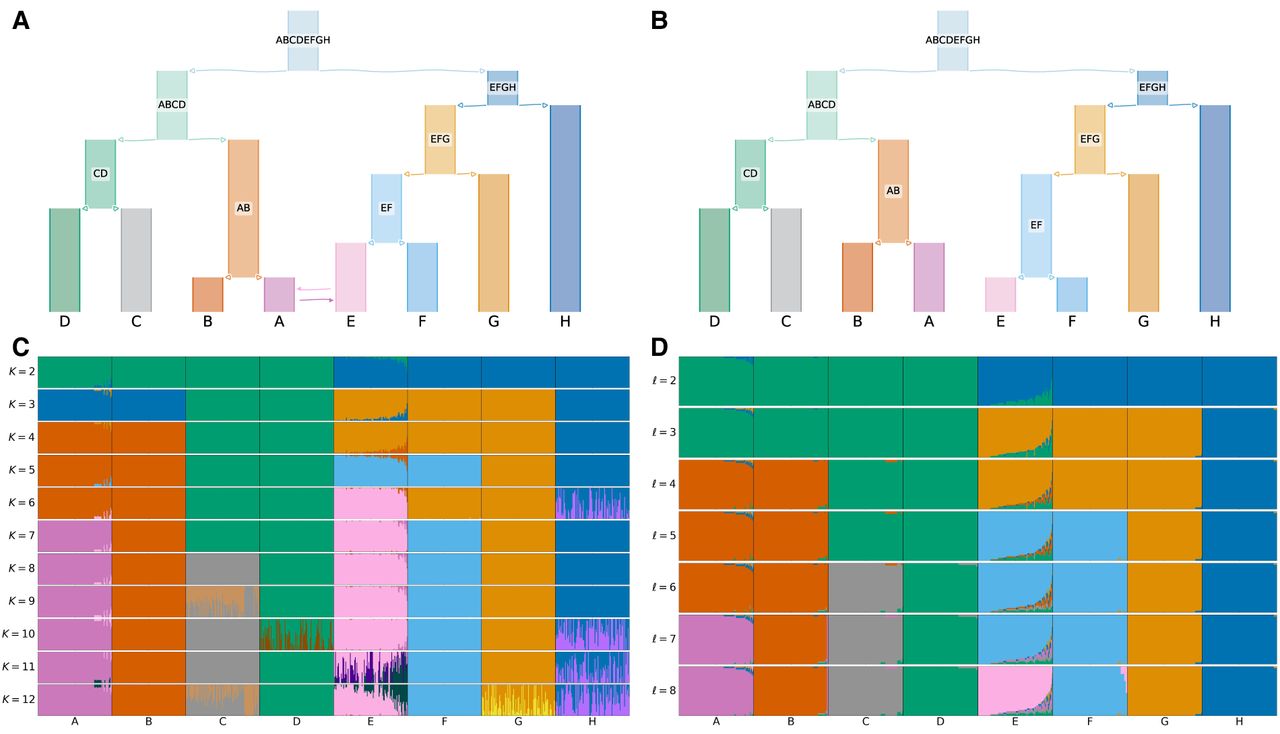
Comparison of ADMIXTURE and tangleGen's inferred hierarchical population structure on simulated data. (A) Underlying demographic structure in simulation with migration added between populations A and E. (B) Inferred population structure by tangleGen. The hierarchy extracted from the tangles tree in tangleGen coincides with the simulated population structure except for the reversed order of splitting AB and EF. Note that tangleGen only estimates the population structure and not the height of the hierarchy; the branch lengths shown here are purely schematic. (A) and (B) are visualized with DemesDraw. (C) ADMIXTURE ancestry proportions. Inferred ancestries by ADMIXTURE from simulated genetic data for different numbers of populations, denoted by K. Individuals are sorted within the populations in the same order as in the tangleGen soft cluster plot D. The best of 10 runs is shown in terms of clarity of clusters and minimization of inconsistencies compared to the underlying population structure. ADMIXTURE estimates the ancestry proportions well for the true number of populations K = 8, but gives also plausible results for other choices of K, although for K > 8 the simulated data does not contain any further population structure. Furthermore, the results for different K show inconsistencies, for example, for K = 3 and also K = 6. (D) Soft clustering of tangleGen. Inferred ancestral relationships by tangleGen on simulated data with underlying demography as shown in A. The individuals are sorted within the populations based on the soft cluster proportions to achieve a block structure in the plots. Each subplot corresponds to a level ℓ in the tangles tree, where the different levels result from splits in the tangles tree. tangleGen clusters individuals hierarchically into the correct populations, whereby the hierarchy matches the underlying population structure up to the lowest level. In contrast to ADMIXTURE, tangleGen independently determines the depth of the population structure and completes the inference when no further SNP-based cuts can be consistently added. Starting with the top split between the ancestral populations ABCD and EFGH, each population split is based on 51, 177, 96, 76, 139, 1, and 18 characteristic SNPs. tangleGen parameters: Agreement parameter a = 50 and cost function as in Equation 2 with k = 40.


