
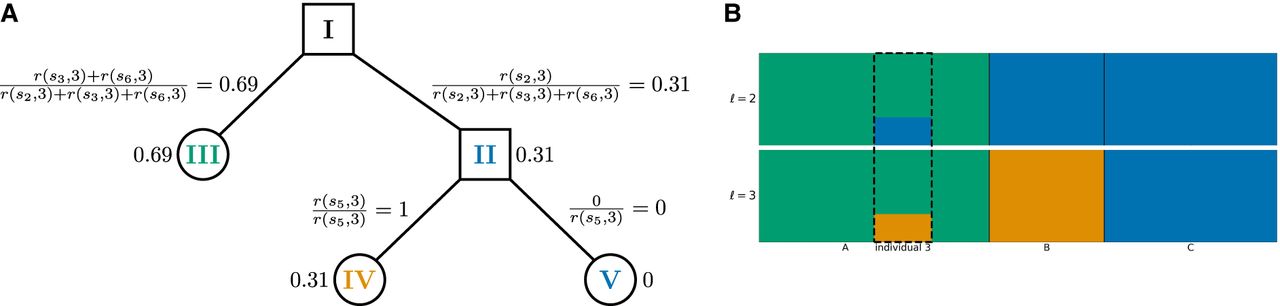
Hierarchical soft clustering for the minimal example. (A) Soft clustering for individual 3 and agreement parameter  , r(s, 3) refers to the reliability factor for SNP s and individual 3 as defined in Equation 5 in the Methods section. (B) Hierarchical clustering plot of the individuals in the minimal example based on the soft clustering, with agreement parameter a = 2. Each subplot corresponds to a level ℓ in the tangles tree (Fig. 2B), where the different levels result from splits in the tangles tree. Individuals are shown on the x-axis, the y-axis illustrates the soft clustering per individual. First bar plot shows clustering into two population, second into three.
Individual 3 is highlighted because the soft clustering in A is calculated for this individual. tangleGen clusters the individuals
hierarchically into the three populations A, B, and C. The first split, which corresponds to the upper bar plot, is supported by three SNPs (s2, s3, and s6) and the second by one SNP (s5).
, r(s, 3) refers to the reliability factor for SNP s and individual 3 as defined in Equation 5 in the Methods section. (B) Hierarchical clustering plot of the individuals in the minimal example based on the soft clustering, with agreement parameter a = 2. Each subplot corresponds to a level ℓ in the tangles tree (Fig. 2B), where the different levels result from splits in the tangles tree. Individuals are shown on the x-axis, the y-axis illustrates the soft clustering per individual. First bar plot shows clustering into two population, second into three.
Individual 3 is highlighted because the soft clustering in A is calculated for this individual. tangleGen clusters the individuals
hierarchically into the three populations A, B, and C. The first split, which corresponds to the upper bar plot, is supported by three SNPs (s2, s3, and s6) and the second by one SNP (s5).


