
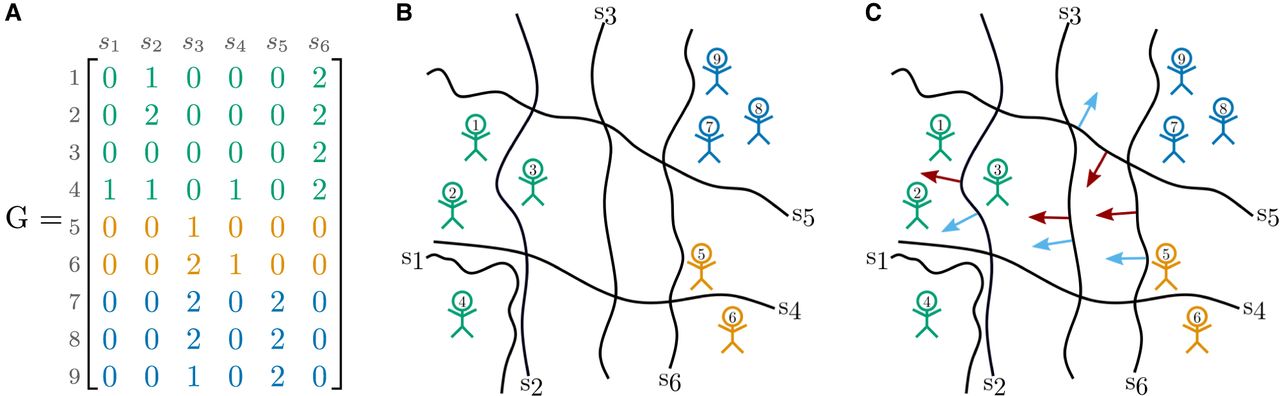
tangleGen concepts: cuts and orientations in a minimal example. (A) Representative genotype matrix, which indicates the number of derived alleles per individual per site. Individuals in the rows, SNPs in the columns. (B) SNPs induce cuts (black lines) on the set of individuals, separating individuals without the derived allele (genotype matrix entry 0) from those carrying at least one derived allele (genotype matrix entry >0). Individuals are shown as stick figures with the corresponding individual IDs. The colors correspond to the underlying population structure. (C) Orientations of cuts: Red arrows indicate a meaningful orientation, that is, a consistent orientation of the cuts for the agreement parameter a = 2, blue arrows indicate a nonmeaningful/inconsistent orientation.


