
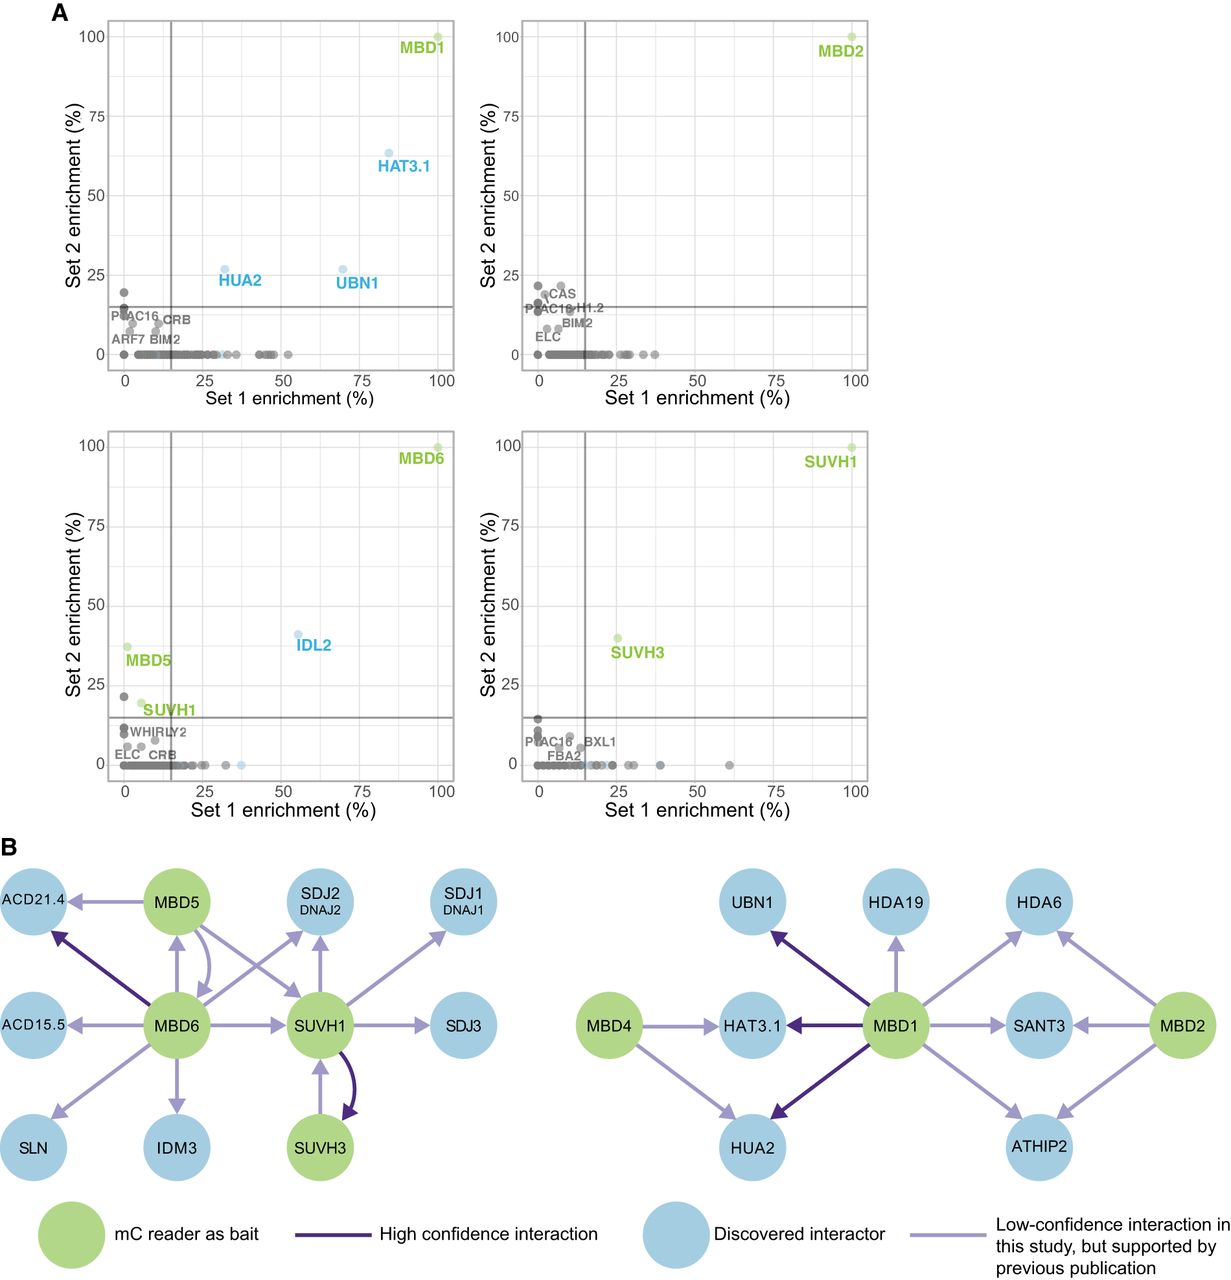
Protein interactors with mC readers. (A) Scatter plots showing the correlation between Set 1 and Set 2 experiments for MBD1, MBD2, MBD6, and SUVH1. The gray lines represent the thresholds to reduce false positive proteins being selected for the interaction network. A 15% threshold for each replicate was selected. mC reader proteins that have been used as baits in this study are green. Interactors identified within this study are blue. (B) A conservative interaction network of proteins in this study. Interactions (edges) identified in both Set 1 and Set 2 experiments are indicated in dark purple. Those edges that were present in our data sets but did not meet our strict criteria, yet that have been identified in another study are indicated in light purple. Nodes (proteins) are colored as in A.


