
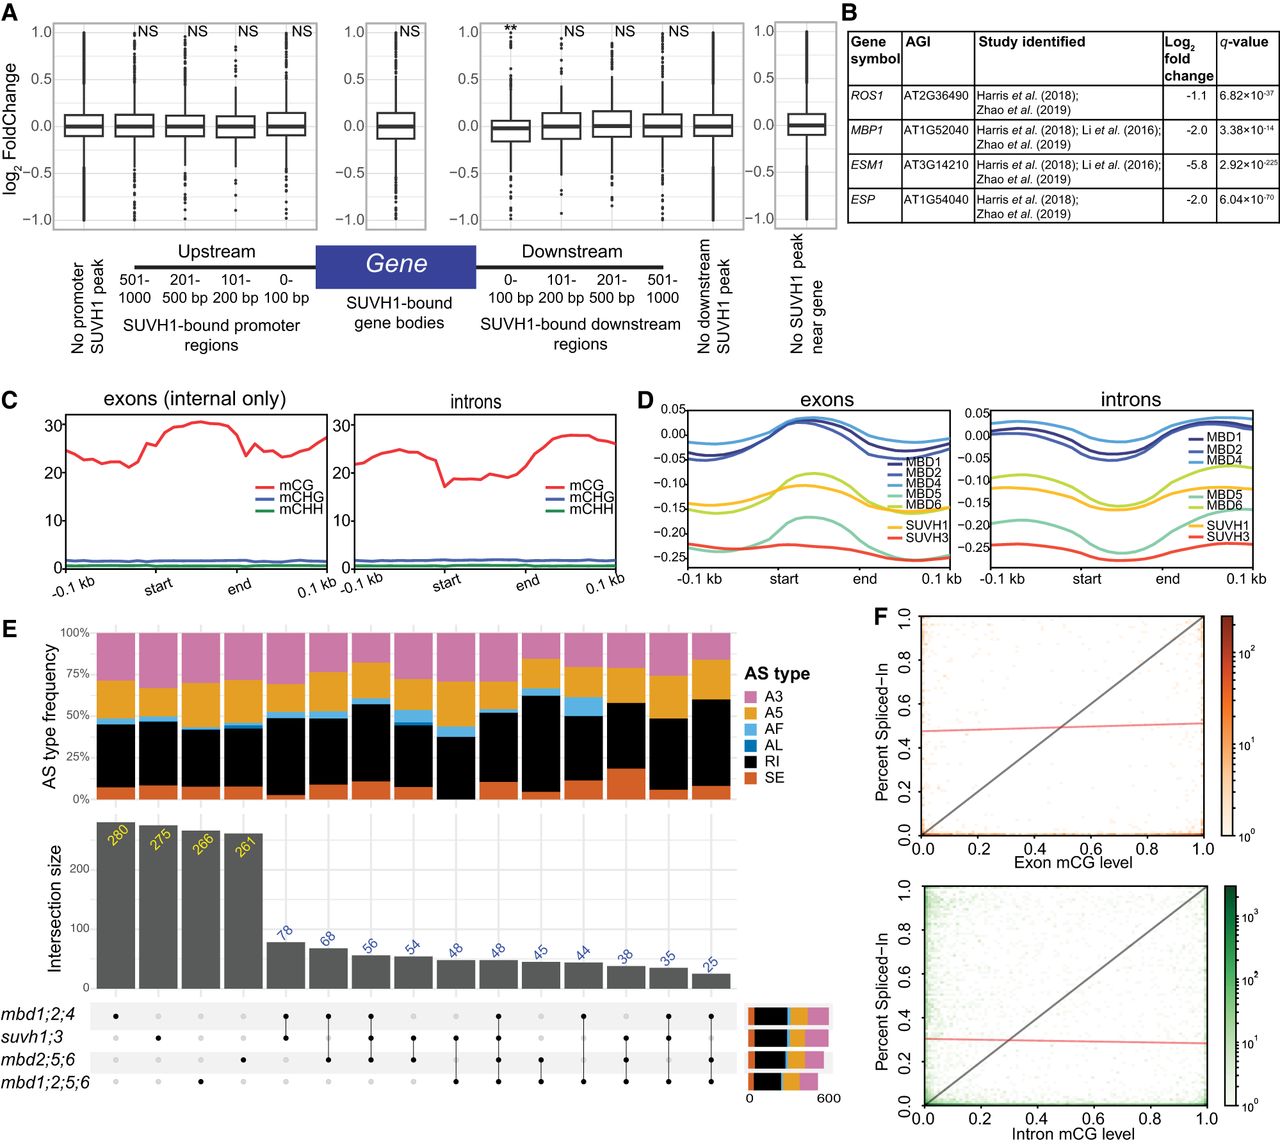
Transcriptomic changes of higher-order mC reader mutants. (A) Expression of protein-coding genes with and without SUVH1-binding sites at various locations relative to the TSS and TES. SUVH1-bound gene bodies were compared to genes with no binding in the gene body or within 1 kb of the gene with regards to changes in expression in the suvh1;3 mutant. The effect of binding within windows downstream from the gene on expression in the suvh1;3 mutant was compared to genes without binding in the downstream region. The same was performed for those binding upstream. (NS) adjusted P-value > 0.05, (**) adjusted P-value < 0.01, after Benjamini–Hochberg correction of Mann–Whitney U test/Wilcoxon rank-sum test. (B) Known targets of SUVH1/3 gene expression changes (log2FC and q-values) in our suvh1;3 double mutant. (C) Metaplots of DNA methylation levels in each sequence context over exons and introns for the de novo transcriptome generated in this study. Exon/intron lengths were normalized to 100 bp using deepTools. (D) Metaplots of mC reader ChIP-seq (log2FC [IP/Input]) over exons and introns similarly to (C). (E) Upset plot showing the number of differential alternative splicing (DAS) events shared between the different higher-order mutants studied. DAS types are skipped exon (SE), retained intron (RI), alternative last exon (AL), alternative first exon (AF), alternative 5′ splice site (A5), and alternative 3′ splice site (A3). (F) Histogram 2D plot of the correlation between exon (top; orange) or intron (bottom: green) mCG level and inclusion rate of the exon (or intron) within the final transcript, as measured by percent spliced-in (PSI). The black line represents a linear relationship between methylation of the exon (or intron) and inclusion of the region in the final transcript and the red line shows the regression from a linear model of their relationship. The Spearman's correlation coefficient for exon mCG and PSI is 0.02 (P-value = 0.4) and the Spearman's correlation coefficient for intron mCG and PSI is −0.001 (P-value = 0.9).


