
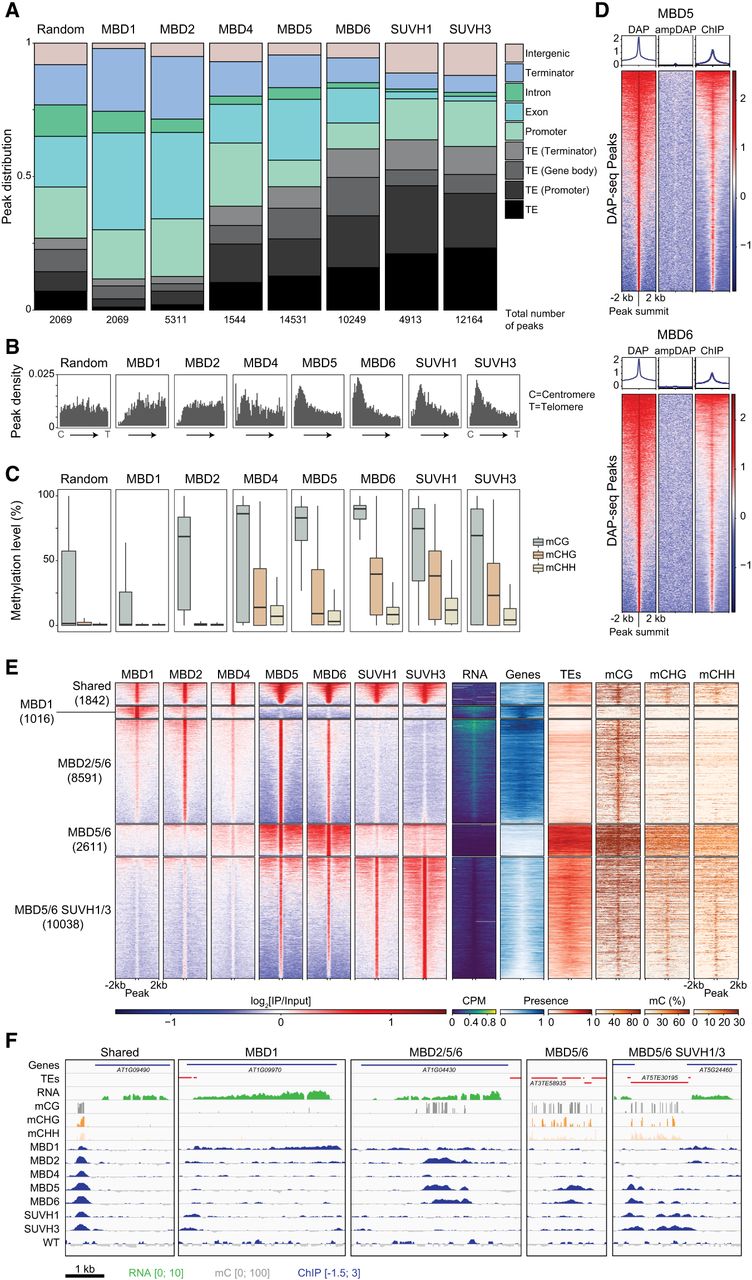
The diverse binding profiles of mC readers across the Arabidopsis genome. (A) Distribution of ChIP-seq peaks in genomic features. The total numbers of peaks for each sample are indicated at the bottom. Original annotations for TEs are indicated in parentheses. Promoters include [−1 kb; +100 bp] around the transcription start site; Terminators include [−100 bp; +1 kb] around the transcription termination site; Genes include both exons and introns. MBD1 peaks were shuffled in the genome to generate a random set of peaks. (B) The density of ChIP-seq peak positions along the Arabidopsis chromosomes, relative to their distance from the centromere (C, on the left) to the telomere of the chromosome arm they are on (T, on the right). (C) Average DNA methylation levels in WT Arabidopsis seedlings under protein-binding sites. Boxplots show the mean and quartiles of all peaks for each sample. For each context, only peaks containing at least three cytosines and a sequencing coverage ≥3 (average on all cytosines in the peak) are presented. (D) DNA affinity purification sequencing for MBD5 (top) and MBD6 (bottom) recombinant proteins on methylated (DAP) and unmethylated (ampDAP) genomic DNA libraries. Heatmaps show enrichment levels at all DAP-seq peaks, and the correlation with in vivo binding assessed by ChIP-seq. (E) Clustering of all mC reader ChIP-seq peaks based on their colocalization. Five clusters were identified, which are bound by different subsets of mC readers, and show different chromatin environments as highlighted by DNA methylation levels in each context, the transcript abundance, and the presence of annotated gene and TE features. (F) Browser displays a representative locus for each cluster defined in (E). ChIP-seq enrichment (log2 Fold Change [IP/Input]) is shown for each mC reader as well as a WT control (where the IP was performed on a WT population, with no tagged protein), along with DNA methylation in each sequence context and RNA expression in WT seedlings (log2 CPM).


