
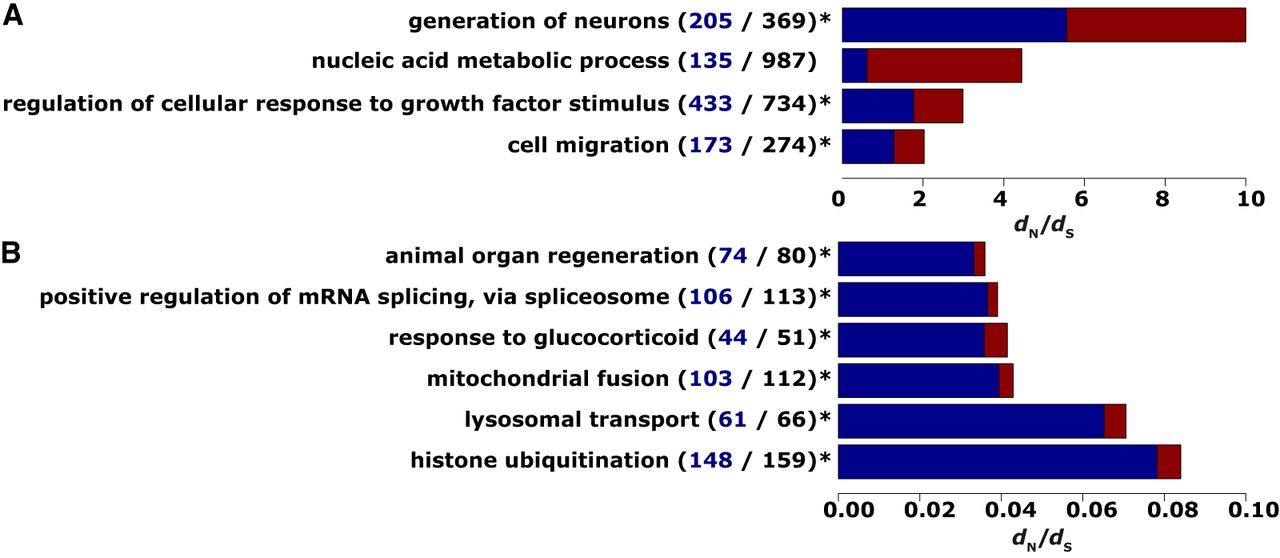
Summary of processes affected (A) by positive selection during 44 years in captivity after last sexual reproduction and (B) by strong negative selection over a longer timescale before last sexual reproduction in the wild. The analysis of single-cell data/somatic SNVs (A) and the comparison of whole-animal data against the Hydra reference genome/germline SNVs (B) resulted in 28 and 274 biological processes affected by positive and strong negative selection, respectively (Supplemental Tables S4, S5). For this overview, processes were summarized by REVIGO (Supek et al. 2011). The total bar length gives the dN/dS value of the respective process; the blue/red part of the bar represents the fraction of expressed/not expressed genes under laboratory conditions. The values in brackets give the number of unique genes that were summarized under the respective term (bold black) and how many of these genes were found to be expressed (blue). An asterisk marks processes with significantly more expressed genes than expected based on the ratio of total expressed genes to total genes examined (11,783/33,820; one-sided Fisher's exact test; FDR < 0.05). Strong negative selection was defined by dN/dS < 0.1.


