
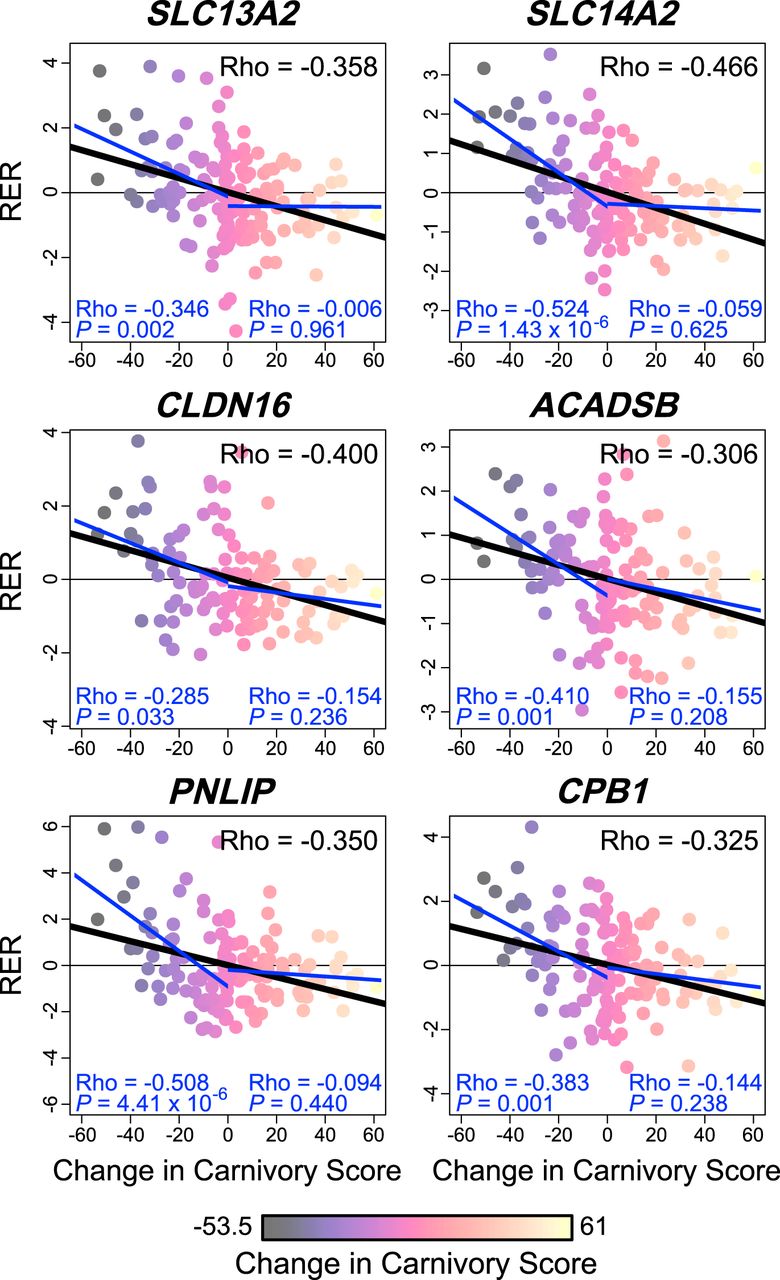
RERs associated with changes in carnivory score across Mammalia for six diet-associated genes: SLC13A2, SLC14A2, CLDN16, ACADSB, PNLIP, and CPB1. As in Figure 1, light yellow and darker purple points indicate increases and decreases in carnivory score, respectively. Lines of best fit represent the relationship between RER and change in carnivory score as inferred by linear regression. Pearson correlation coefficients (Rho) represent the strength and direction of correlations between RER and change in carnivory score. Black lines of best fit and correlation coefficients (upper right values) represent the relationship across all changes in carnivory score, as inferred by our continuous RERconverge analysis. Blue lines, with associated correlations, represent the relationship with RER for only decreases (left) or increases (right) in carnivory score.


