
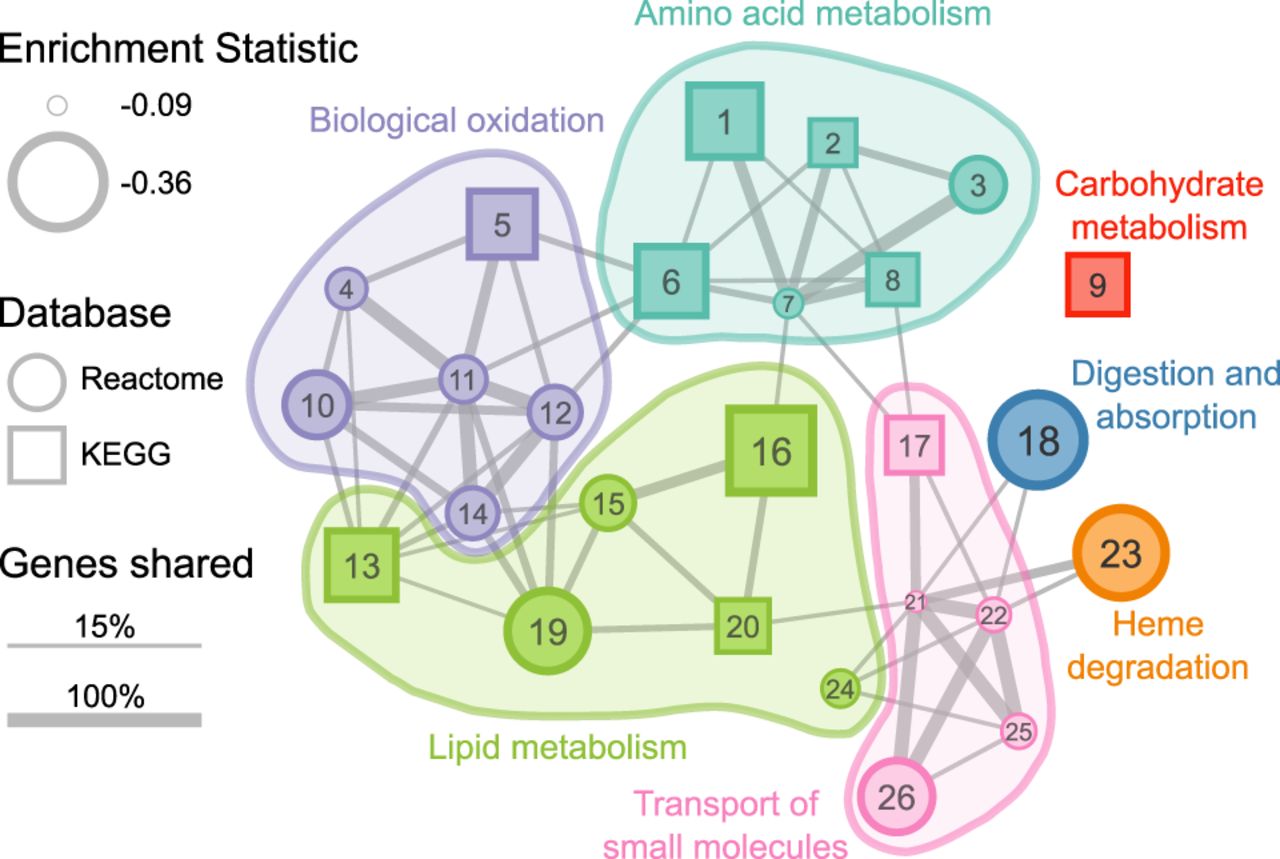
Significantly enriched gene pathways (n = 26) for genes whose evolutionary rates are negatively correlated with carnivory score. Each circle or square represents a gene pathway. Circles and squares represent pathways from the Reactome and KEGG databases, respectively. The size of the shape represents the magnitude of the difference between the distribution of test statistics for genes in that pathway and the distribution for all other genes. Larger shapes, representing pathways with more negative correlation statistics, indicate greater reductions in evolutionary constraint as the carnivory score decreases. The width of lines connecting pathways represents the proportion of shared genes in the smaller gene set. Colors represent the broad functional categories that the pathways occupy. (1) Glycine, serine, and threonine metabolism; (2) Cysteine and methionine metabolism; (3) Sulfur amino acid metabolism; (4) Phase II—Conjugation of compounds; (5) Drug metabolism—Cytochrome P450; (6) Phenylalanine metabolism; (7) Metabolism of amino acids and derivatives; (8) Arginine and proline metabolism; (9) Starch and sucrose metabolism; (10) Metabolic disorders of biological oxidation enzymes; (11) Biological oxidations; (12) Phase I—Functionalization of compounds; (13) Steroid hormone biosynthesis; (14) Cytochrome P450—Arranged by substrate type; (15) Fatty acid metabolism (Reactome); (16) Fatty acid metabolism (KEGG); (17) Proximal tubule bicarbonate reclamation; (18) Digestion and absorption; (19) Synthesis of bile acids and bile salts via 7alpha-hydroxycholesterol; (20) PPAR signaling pathway; (21) Transport of small molecules; (22) SLC-mediated transmembrane transport; (23) Heme degradation; (24) Synthesis of phosphatidylcholine; (25) Transport of bile salts and organic acids, metal ions, and amine compounds; (26) Amino acid transport across the plasma membrane. A table of results for all gene pathways tested (n = 1290) is available in Supplemental Table S5.


