
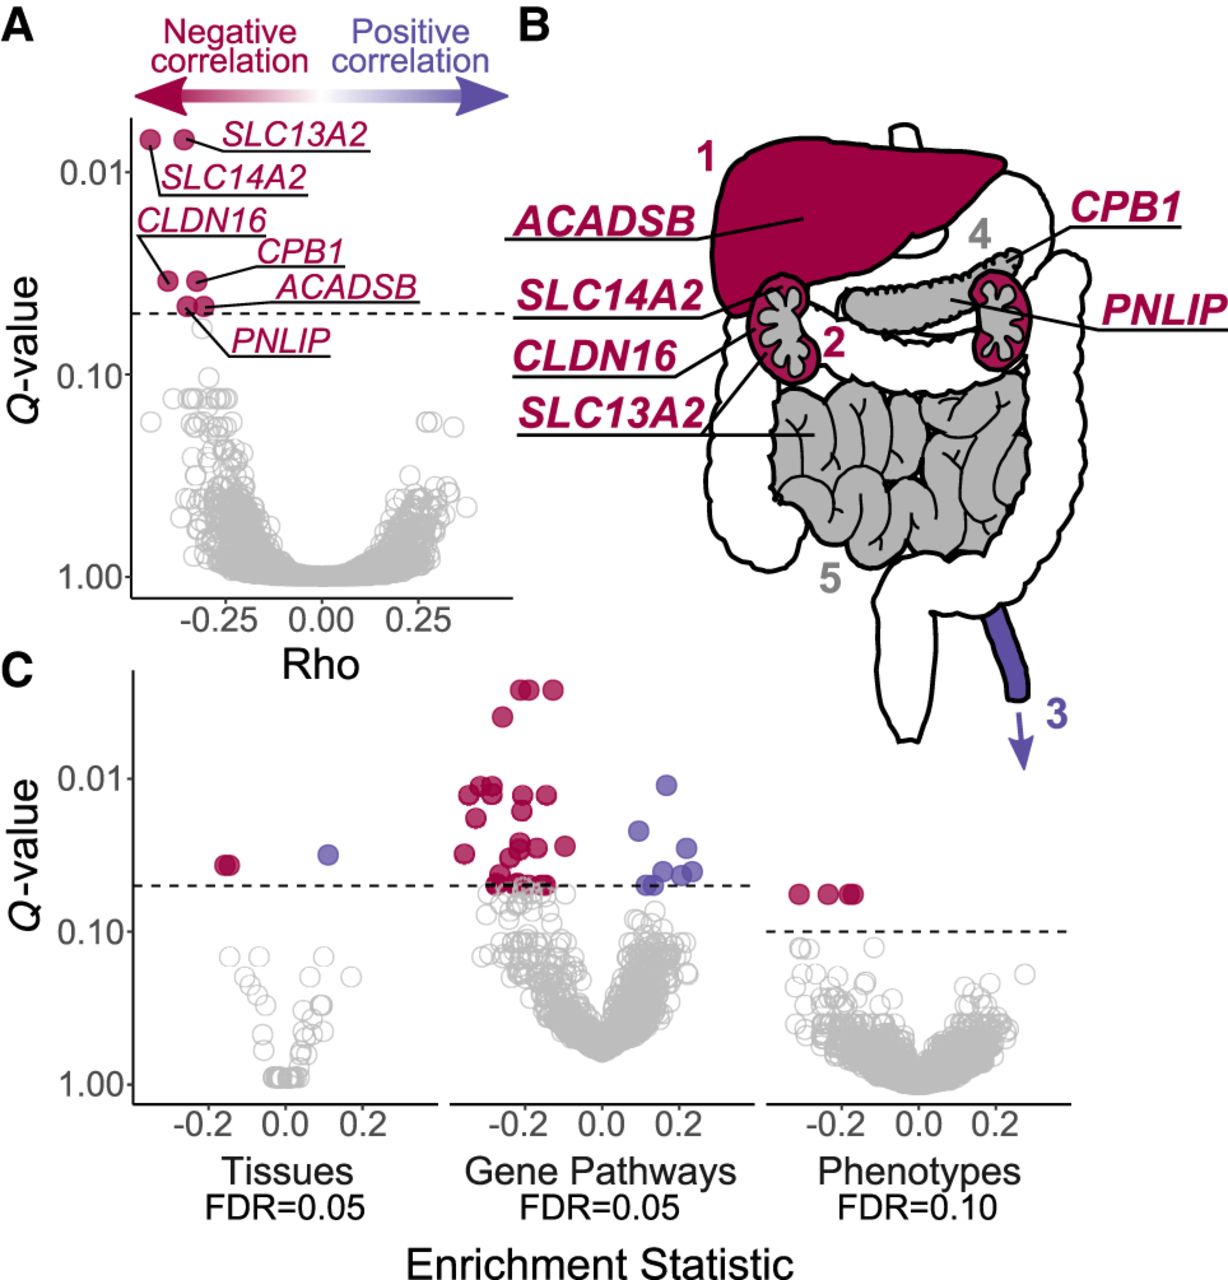
Top genes and pathways with signatures of diet-associated evolutionary constraint. (A) Genes identified by RERconverge as having a significant association between RER and change in carnivory score. A negative correlation (Rho) signifies the following pattern: the greater the decrease in carnivory, the higher the rate of evolution of the gene. A positive correlation indicates the opposite pattern. After 100,000 permulations, six genes showed a significant association, and each evolved faster in association with decreased carnivory (FDR = 0.05). (B) Tissues enriched for positive (purple) and negative (red) correlations, where: 1 = liver, 2 = kidneys, 3 = tibial artery, 4 = pancreas, 5 = small intestine. Some tissues are annotated with the genes found to be individually significant. The annotated tissues are the locations of highest expression for those genes in adult humans, according to the Genotype-Tissue Expression Project (2015). Gray represents tissues that were not significantly enriched but were sites of strongest expression for individually significant genes. (C) Biological functions showing constraints associated with the change in diet. We used RERconverge to test for enrichment of gene sets representing tissues (n = 50), gene pathways (n = 1290), and abnormal phenotypes (n = 3560). For tissues, two gene sets were enriched for negative correlations, and one set was enriched for positive correlations (Supplemental Table S4). For gene pathways, 26 gene sets were enriched for negative correlations, and eight sets were enriched for positive correlations (Supplemental Table S5). For abnormal phenotypes, five gene sets were enriched for negative correlations (Supplemental Table S6).


