
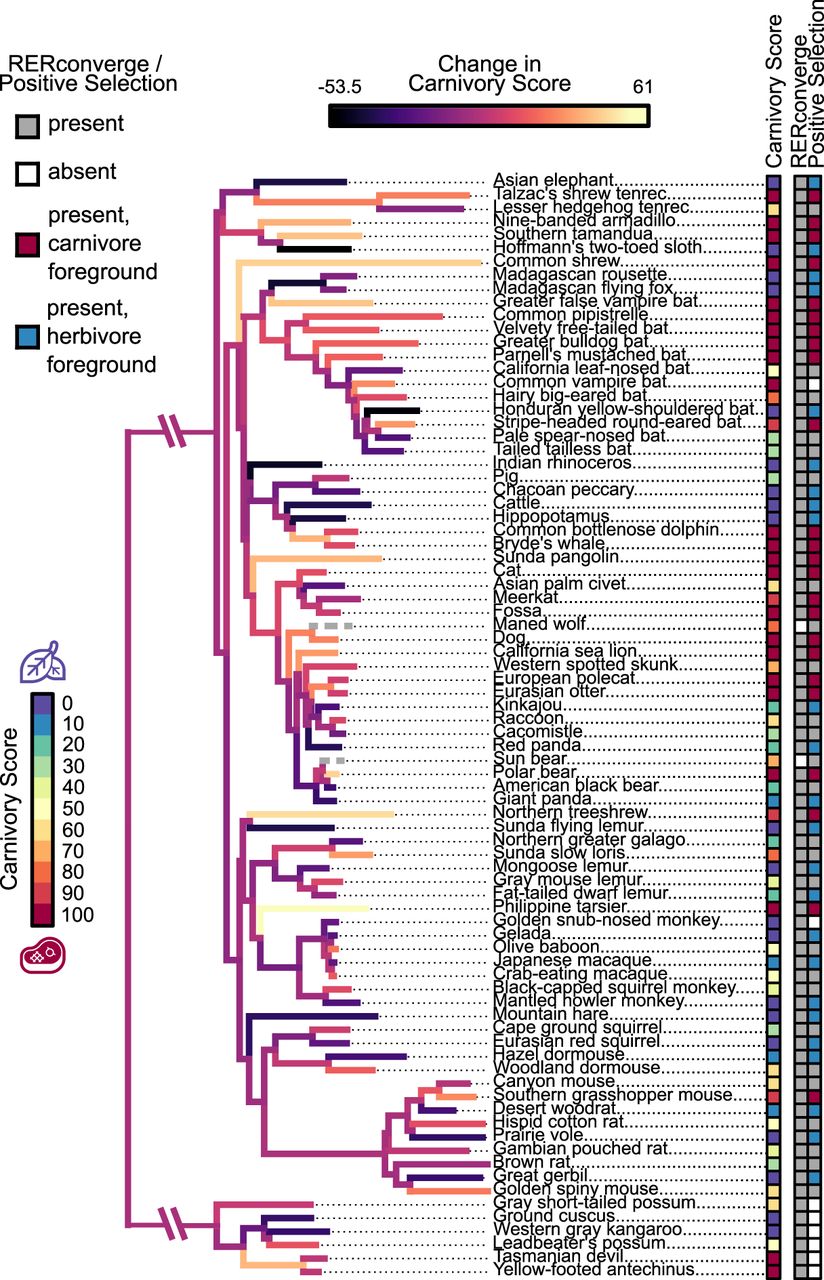
Species selection for comparative genomic analyses of mammalian diet. The carnivory score represents the proportion of the diet composed of animal-based food items for each species, as listed in EltonTraits (Wilman et al. 2014). This score was used as input in our RERconverge analyses and informed the selection of foreground species in our tests for positive selection. Branch colors represent the magnitude and direction of change in carnivory score across the phylogeny, as inferred by using fast estimation of maximum likelihood ancestral states (Revell 2012). Bright yellow and dark purple branches indicate increases and decreases in carnivory score, respectively. Gray dashed branches represent species—maned wolf and sun bear—that were not included in our RERconverge analyses and so were not used to estimate the change in carnivory score. Branch length represents the average evolutionary rate across all genes for a given branch of the maximum clade credibility phylogeny of Upham et al. (2019), as reported by RERconverge. Most species were included in both the RERconverge and positive selection analyses and are marked as present (gray, red, blue) in the corresponding columns. Species not included in an analysis are marked as absent (white). For the positive selection analyses, species included in the carnivorous (carnivory score ≥90) and herbivorous (carnivory score ≤10) foregrounds are marked in the corresponding column as red and blue, respectively. Scientific names and carnivory scores are provided for each species in Supplemental Table S1.


