
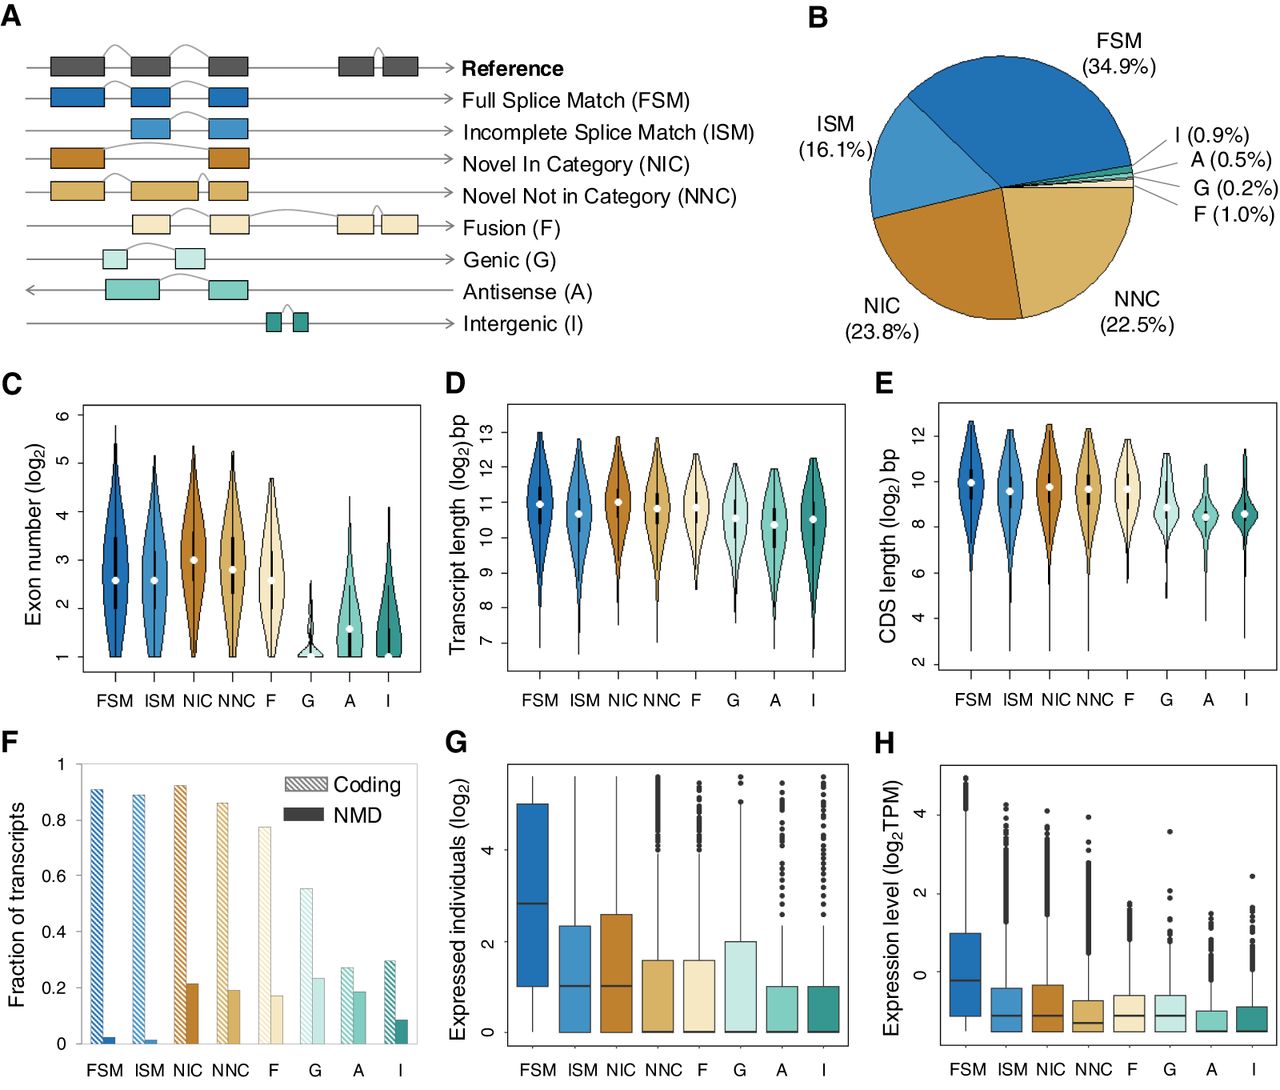
Characterization of all detected high-confidence isoforms. (A) Types and illustrations of identified isoforms. Novel transcript versions are depicted in italics. (B) Fraction distribution of isoform structural categories (see isoform annotations in Supplemental Data S2). (C–H) The distributions of isoform types for distinct features. Isoforms with expression were defined as those with nonzero TPM values, and the expression levels were computed based on the number of supported FLNC reads using SQANTI3 (Tardaguila et al. 2018). Boxes represent the IQR (distance between the first and third quartiles), with white dots (or black lines) in the middle to denote the median. The boundaries of the whiskers (also the ranges of violins for panels C–E) are based on the 1.5 IQR values for both sides; black dots in G and H represent outliers.


