
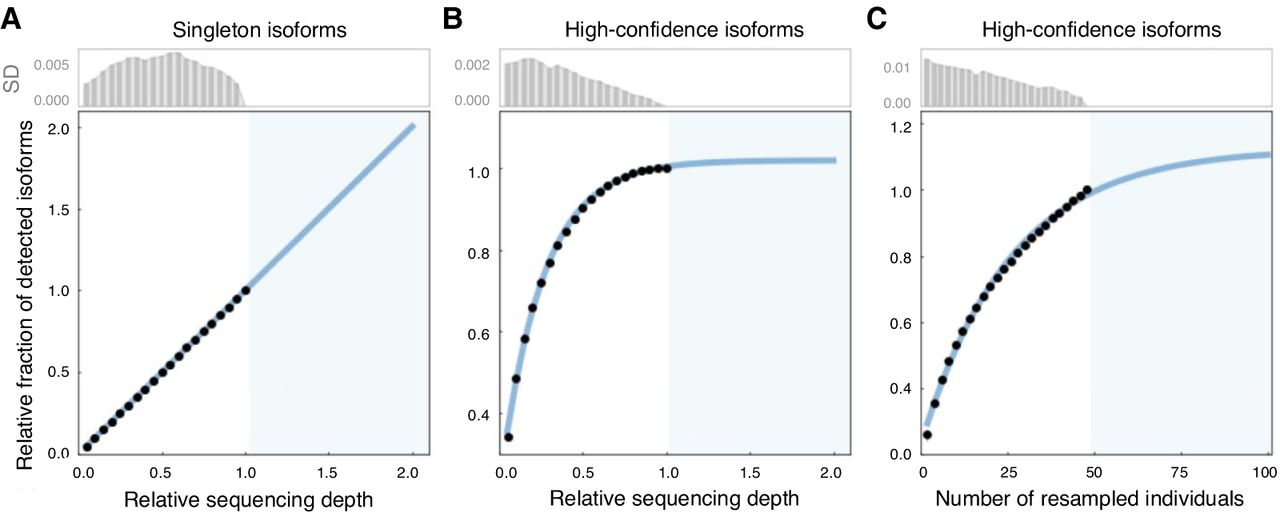
Saturation analysis on the sequencing depth and number of sampled individuals. (A,B) The relative fractions of detected isoforms supported with singleton FLNC read versus two or more FLNC reads (high-confidence isoforms) with increasing random resampling of the Iso-Seq sequencing depth, respectively. The resampling sequencing depths were selected from 0.05 to 1, with a step size of 0.05. The blue area shows the prediction after doubling the actual Iso-Seq sequencing depth. The illustration is based on one randomly selected individual (GE3) in the GE population; the analogous results for individuals from other populations are provided in Supplemental Figures S8 and S9. (C) Relative fractions of detected isoforms with increasing random resampling sample sizes of individuals in the main experiment. The resampling sequencing sizes were selected from 2 to 48, with a step size of 2. The blue area shows the prediction after doubling the current sampling of mice individuals. The bar plots show the SD of each resampling analysis.


