
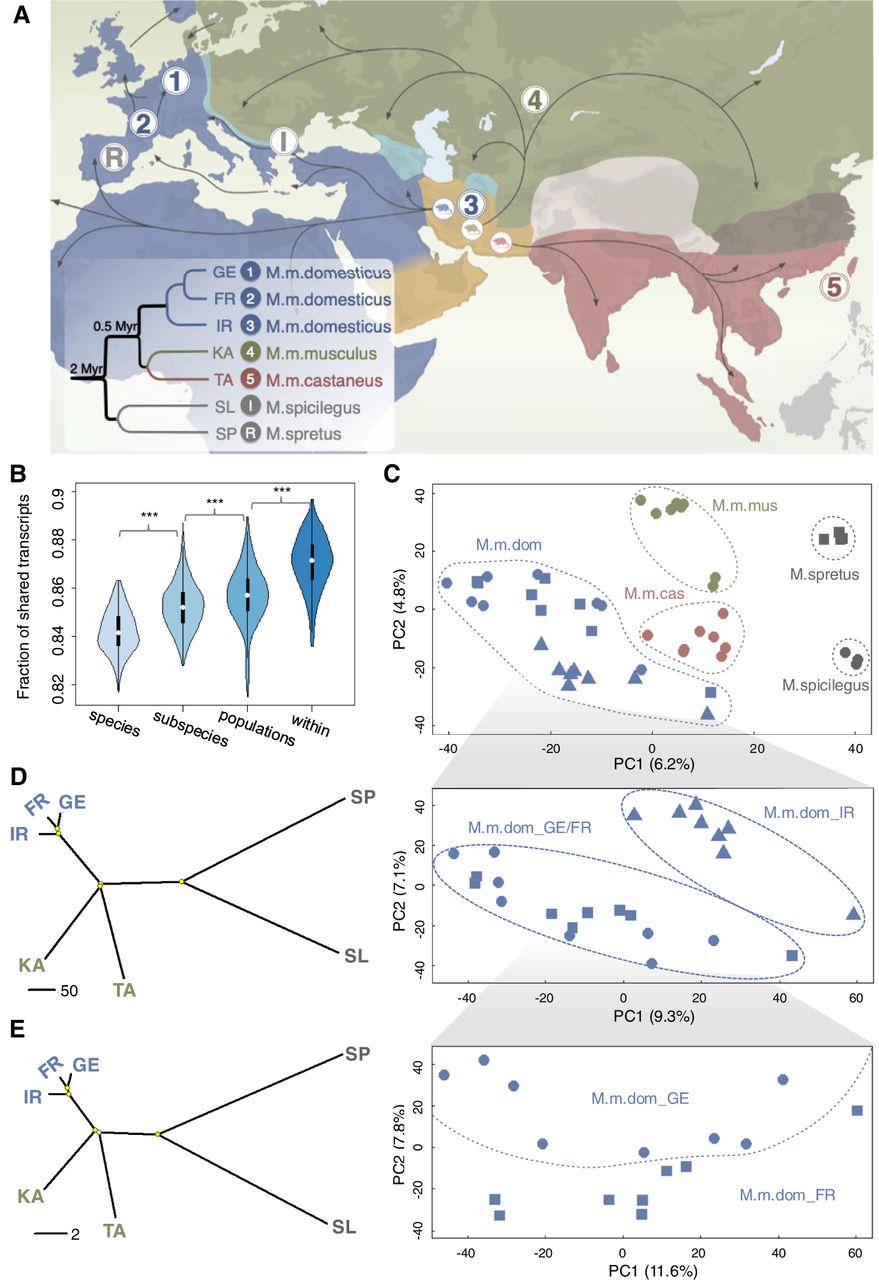
Geographic locations and phylogenetic relations of sampled mice individuals. (A) Geographic locations for the sampled mouse populations in this study. Territory areas for each house mouse subspecies: M. m. domesticus (blue), M. m. musculus (green), and M. m. castaneus (brown). Black arrows indicate possible migration routes, mainly during the spread of agriculture and trading. The inset figure shows the canonical phylogenetic relationships among the house mouse populations and outgroup species (branch lengths not scaled). Geographic locations: 1, Germany (GE); 2, France (FR); 3, Iran (IR); 4, Kazakhstan (KA); 5, Taiwan (TA). The sampling locations for the outgroup species are I, Slovakia (SL) for M. spicilegus and R, Spain (SP) for M. spretus. (B) The fraction of shared isoforms for pairwise individual comparisons between and within the taxa. The fraction of shared isoforms between each pair of individuals is defined as the number of overlapping isoforms divided by the average number of detected isoforms of the two individuals to compare. Black boxes represent the interquartile range (IQR, distance between the first and third quartiles), with white dots in the middle to denote the median. The boundaries of the whiskers (also the ranges of violins) are based on the 1.5 IQR values for both sides. The statistical P-values of the fractions of shared isoforms between different comparison groups were computed using Wilcoxon rank sum tests; (***) P < 10−7. (C) The projection of the top two PCs of isoform variation in house mouse and outgroup individuals. Enlarged insets represent the results for the three populations from the subspecies of M. m. domesticus, as they cannot be well distinguished in the main figure. (D,E) Phylogenetic trees built based on isoform and SNP variants fixed within each population, respectively. Split nodes marked in yellow are the ones with bootstrap support value >70%.


