
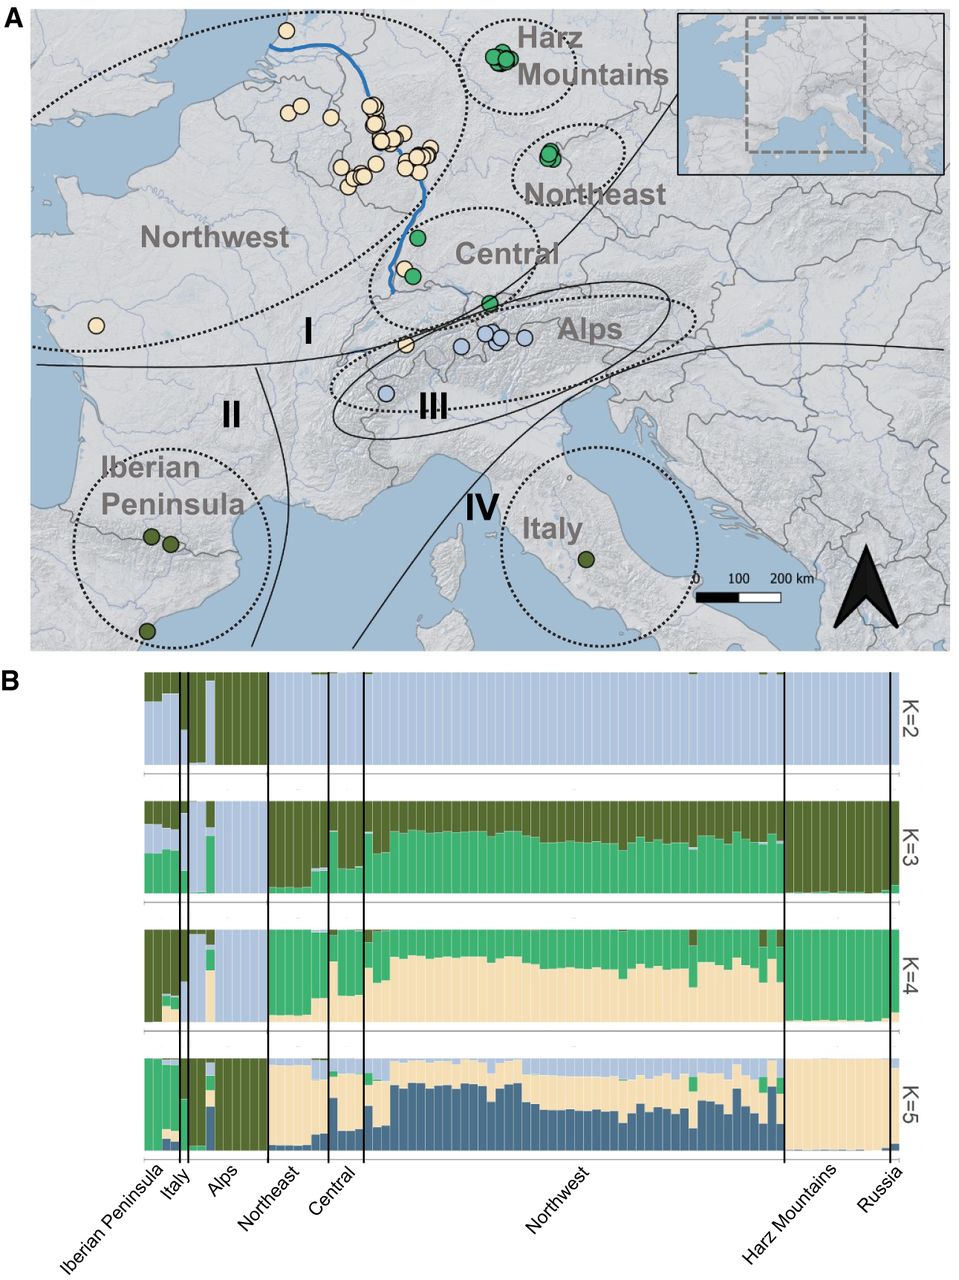
Garden dormouse population structure inferred from 47,115 nuclear SNP loci. (A) Group assignment via five PCs obtained by a discriminant analysis of principal components. The predicted assignment of genetic clusters (K) 1–3 is shown by four different colors and the a priori sampling region identity is highlighted by dotted gray lines and text. The clades I–IV that were previously identified based on mitochondrial DNA (Perez et al. 2013) are outlined in black. One sample from Russia is not pictured. The Rhine River is outlined in blue, and the boundary of the study area is outlined in gray in the inset map. (B) Genetic clustering inferred by Bayesian structure analysis for K ranging from 2 to 5 in STRUCTURE, with x-axes representing geographic sampling location and y-axes the proportion of group membership.


