
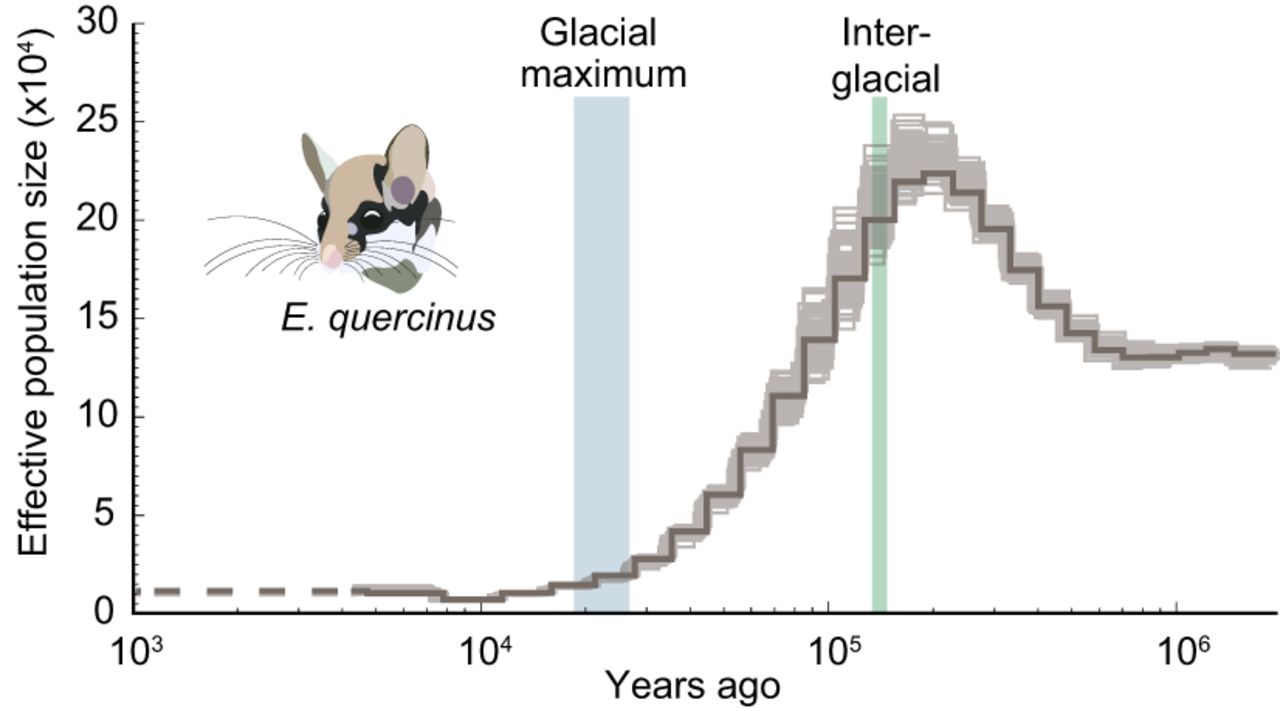
Figure 3.
Demographic history of the garden dormouse. Effective population size (Ne) of E. quercinus as estimated with PSMC. Ne in 10,000 is shown on the y-axis and time in years ago on the x-axis. Faint lines indicate uncertainty of inferred Ne based on 100 bootstrap replicates. Blue and green bars show the timing of the last glacial maximum and last interglacial, respectively. The most recent Ne estimate with reduced accuracy is displayed by a dotted line on the left.


