
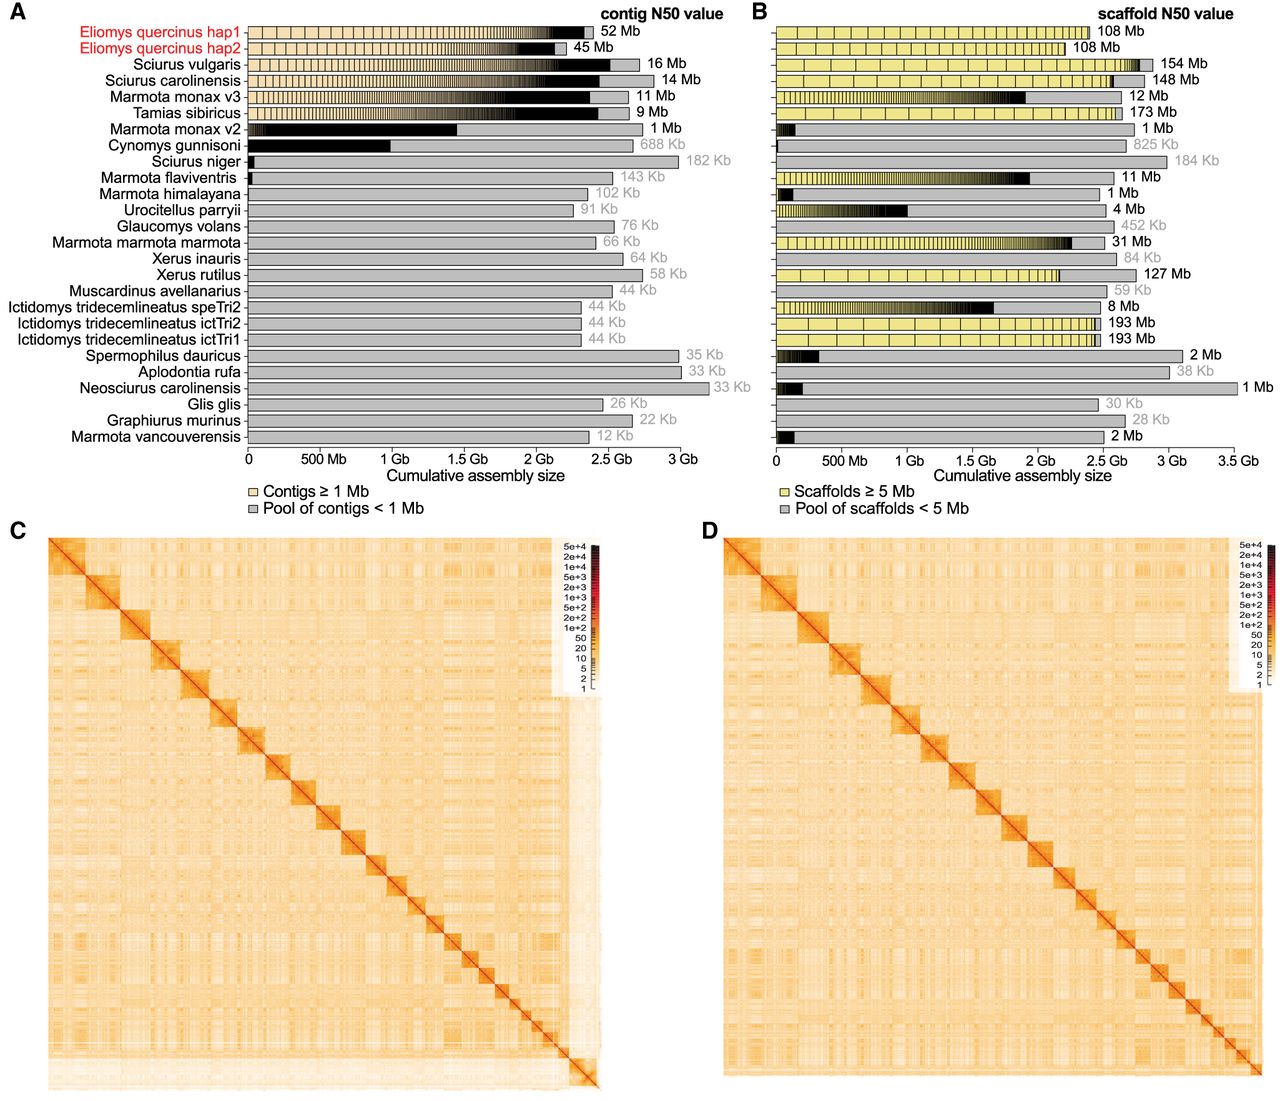
Figure 1.
Contiguity and Hi-C maps of both haplotype assemblies. (A,B) Visualization of contig (A) and scaffold (B) sizes of the garden dormouse haplotypes 1 and 2 (red font) and other Sciuromorpha genome assemblies. The N50 values are given on the right side. Contigs shorter than 1 Mb and scaffolds shorter than 5 Mb are not visualized individually, but shown as the gray portion of each bar. (C,D) Hi-C density maps for haplotype 1 (C) and haplotype 2 (D).


